|
1500
|
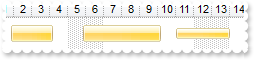
How can I add a Zero-Lenght bar
OBJECT chart,columns,g2antt,items;

g2antt =  ObjectByName("AN1") ;
_ObjectCallMethod( g2antt , "BeginUpdate");
_ObjectSetProperty( g2antt , "MarkSearchColumn", 0);
columns = _ObjectGetProperty( g2antt , "Columns");
	_ObjectCallMethod( columns , "Add", "Tasks");
	_ObjectCallMethod(g2antt, "TemplatePut", "Dim colObj")
	_ObjectCallMethod(g2antt, "TemplatePut", columns)
	_ObjectCallMethod(g2antt, "ExecuteTemplate", "colObj.Add(`Start`).Def(18) = 1");
	_ObjectCallMethod(g2antt, "ExecuteTemplate", "colObj.Add(`End`).Def(18) = 2");
	_ObjectCallMethod(g2antt, "ExecuteTemplate", "colObj.Add(`Duration`).Def(18) = 258");
chart = _ObjectGetProperty( g2antt , "Chart");
	_ObjectSetProperty( chart , "FirstVisibleDate", "9/20/2010");
	_ObjectSetProperty( chart , "LevelCount", 2);
	_ObjectCallMethod(g2antt, "TemplatePut", "Dim chaObj")
	_ObjectCallMethod(g2antt, "TemplatePut", chart)
	_ObjectCallMethod(g2antt, "ExecuteTemplate", "chaObj.PaneWidth(0) = 256");
	_ObjectSetProperty( chart , "AllowLinkBars", 0);
items = _ObjectGetProperty( g2antt , "Items");
	_ObjectSetProperty( items , "AllowCellValueToItemBar", -1);
	h1 = _ObjectCallMethod( items , "AddItem", "M1");
	_ObjectCallMethod( items , "AddBar", h1,"Milestone","9/29/2010","9/29/2010");
	_ObjectCallMethod(g2antt, "TemplatePut", "Dim iteObj,h1")
	_ObjectCallMethod(g2antt, "TemplatePut", items)
	_ObjectCallMethod(g2antt, "TemplatePut", h1)
	_ObjectCallMethod(g2antt, "ExecuteTemplate", "iteObj.ItemBar(h1,``,20) = True");
_ObjectCallMethod( g2antt , "EndUpdate");
|
|
1499
|
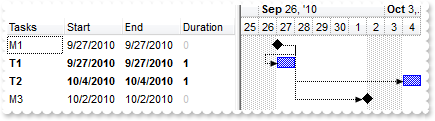
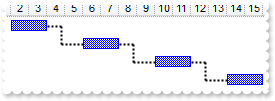
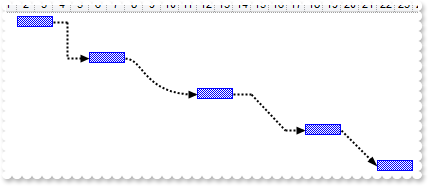
Can I use bars like Milestone (Zero-Length bar) in SchedulePDM
// BarResizing event - Occurs when a bar is moving or resizing.
FUNCTION g2anttEvents_BarResizing(OBJECT g2antt, INT Item, VARIANT Key)
	Message( _ObjectCallMethod( _ObjectGetProperty( g2antt , "Items") , "SchedulePDM", Item,Key) );
END

OBJECT chart,columns,conditionalformat,g2antt,items;

g2antt =  ObjectByName("AN1") ;
ObjectAssociateEvents("g2anttEvents", g2antt);
_ObjectCallMethod( g2antt , "BeginUpdate");
_ObjectSetProperty( g2antt , "MarkSearchColumn", 0);
columns = _ObjectGetProperty( g2antt , "Columns");
	_ObjectCallMethod( columns , "Add", "Tasks");
	_ObjectCallMethod(g2antt, "TemplatePut", "Dim colObj")
	_ObjectCallMethod(g2antt, "TemplatePut", columns)
	_ObjectCallMethod(g2antt, "ExecuteTemplate", "colObj.Add(`Start`).Def(18) = 1");
	_ObjectCallMethod(g2antt, "ExecuteTemplate", "colObj.Add(`End`).Def(18) = 543");
	_ObjectCallMethod(g2antt, "ExecuteTemplate", "colObj.Add(`Duration`).Def(18) = 258");
conditionalformat = _ObjectCallMethod( _ObjectGetProperty( g2antt , "ConditionalFormats") , "Add", "%3");
	_ObjectSetProperty( conditionalformat , "Bold", -1);
	_ObjectSetProperty( conditionalformat , "ApplyTo", -1);
conditionalformat = _ObjectCallMethod( _ObjectGetProperty( g2antt , "ConditionalFormats") , "Add", "%3 = 0");
	_ObjectSetProperty( conditionalformat , "ForeColor", 12895428);
	_ObjectSetProperty( conditionalformat , "ApplyTo", 3);
chart = _ObjectGetProperty( g2antt , "Chart");
	_ObjectSetProperty( chart , "FirstVisibleDate", "9/20/2010");
	_ObjectSetProperty( chart , "LevelCount", 2);
	_ObjectCallMethod(g2antt, "TemplatePut", "Dim chaObj")
	_ObjectCallMethod(g2antt, "TemplatePut", chart)
	_ObjectCallMethod(g2antt, "ExecuteTemplate", "chaObj.PaneWidth(0) = 256");
	_ObjectSetProperty( _ObjectCallMethod( _ObjectGetProperty( chart , "Bars") , "Add", "Task:Split") , "Shortcut", "Task");
items = _ObjectGetProperty( g2antt , "Items");
	_ObjectSetProperty( items , "AllowCellValueToItemBar", -1);
	h1 = _ObjectCallMethod( items , "AddItem", "M1");
	_ObjectCallMethod( items , "AddBar", h1,"Milestone","9/27/2010","9/27/2010");
	_ObjectCallMethod(g2antt, "TemplatePut", "Dim iteObj,h1")
	_ObjectCallMethod(g2antt, "TemplatePut", items)
	_ObjectCallMethod(g2antt, "TemplatePut", h1)
	_ObjectCallMethod(g2antt, "ExecuteTemplate", "iteObj.ItemBar(h1,``,20) = True");
	h2 = _ObjectCallMethod( items , "AddItem", "T1");
	_ObjectCallMethod( items , "AddBar", h2,"Task","9/27/2010","9/27/2010");
	_ObjectCallMethod(g2antt, "TemplatePut", "Dim iteObj,h2")
	_ObjectCallMethod(g2antt, "TemplatePut", items)
	_ObjectCallMethod(g2antt, "TemplatePut", h2)
	_ObjectCallMethod(g2antt, "ExecuteTemplate", "iteObj.ItemBar(h2,``,543) = #9/27/2010#");
	_ObjectCallMethod(g2antt, "ExecuteTemplate", "iteObj.ItemBar(h2,``,20) = True");
	_ObjectCallMethod( items , "AddLink", "L1",h1,"",h2,"");
	h3 = _ObjectCallMethod( items , "AddItem", "T2");
	_ObjectCallMethod( items , "AddBar", h3,"Task","9/27/2010","9/27/2010");
	_ObjectCallMethod(g2antt, "TemplatePut", "Dim iteObj,h3")
	_ObjectCallMethod(g2antt, "TemplatePut", items)
	_ObjectCallMethod(g2antt, "TemplatePut", h3)
	_ObjectCallMethod(g2antt, "ExecuteTemplate", "iteObj.ItemBar(h3,``,543) = #9/27/2010#");
	_ObjectCallMethod(g2antt, "ExecuteTemplate", "iteObj.ItemBar(h3,``,20) = True");
	_ObjectCallMethod( items , "AddLink", "L2",h1,"",h3,"");
	_ObjectCallMethod(g2antt, "TemplatePut", "Dim iteObj")
	_ObjectCallMethod(g2antt, "TemplatePut", items)
	_ObjectCallMethod(g2antt, "ExecuteTemplate", "iteObj.Link(`L2`,16) = 5");
	h4 = _ObjectCallMethod( items , "AddItem", "M3");
	_ObjectCallMethod( items , "AddBar", h4,"Milestone","9/27/2010","9/27/2010");
	_ObjectCallMethod(g2antt, "TemplatePut", "Dim iteObj,h4")
	_ObjectCallMethod(g2antt, "TemplatePut", items)
	_ObjectCallMethod(g2antt, "TemplatePut", h4)
	_ObjectCallMethod(g2antt, "ExecuteTemplate", "iteObj.ItemBar(h4,``,20) = False");
	_ObjectCallMethod( items , "AddLink", "L3",h1,"",h4,"");
	_ObjectCallMethod(g2antt, "TemplatePut", "Dim iteObj")
	_ObjectCallMethod(g2antt, "TemplatePut", items)
	_ObjectCallMethod(g2antt, "ExecuteTemplate", "iteObj.Link(`L3`,16) = 5");
	_ObjectCallMethod( items , "SchedulePDM", 0,"");
_ObjectCallMethod( g2antt , "EndUpdate");
|
|
1498
|
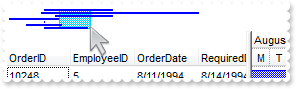
How can I prevent vertical scrolling when user clicks the overview part of the control
// AddItem event - Occurs after a new Item has been inserted to Items collection.
FUNCTION g2anttEvents_AddItem(OBJECT g2antt, INT Item)
	OBJECT items;
	items = _ObjectGetProperty( g2antt , "Items");
		_ObjectCallMethod(g2antt, "TemplatePut", "Dim iteObj,Item")
		_ObjectCallMethod(g2antt, "TemplatePut", items)
		_ObjectCallMethod(g2antt, "TemplatePut", Item)
		_ObjectCallMethod( items , "AddBar", Item,"Task",_ObjectCallMethod(g2antt, "ExecuteTemplate", "iteObj.CellValue(Item,2)"),_ObjectCallMethod(g2antt, "ExecuteTemplate", "iteObj.CellValue(Item,4)"));
END

OBJECT chart,g2antt,rs;

g2antt =  ObjectByName("AN1") ;
ObjectAssociateEvents("g2anttEvents", g2antt);
_ObjectCallMethod( g2antt , "BeginUpdate");
chart = _ObjectGetProperty( g2antt , "Chart");
	_ObjectSetProperty( chart , "FirstVisibleDate", "8/3/1994");
	_ObjectCallMethod(g2antt, "TemplatePut", "Dim chaObj")
	_ObjectCallMethod(g2antt, "TemplatePut", chart)
	_ObjectCallMethod(g2antt, "ExecuteTemplate", "chaObj.PaneWidth(False) = 256");
	_ObjectSetProperty( chart , "LevelCount", 2);
	_ObjectSetProperty( chart , "UnitScale", 4096);
	_ObjectSetProperty( chart , "FirstWeekDay", 1);
	_ObjectSetProperty( chart , "OverviewVisible", 2);
_ObjectSetProperty( g2antt , "ColumnAutoResize", 0);
_ObjectSetProperty( g2antt , "ContinueColumnScroll", 0);
rs = CreateObject("ADOR.Recordset");
	_ObjectCallMethod( rs , "Open", "Orders","Provider=Microsoft.ACE.OLEDB.12.0;Data Source=C:\Program Files\Exontrol\ExG2antt\Sample\Access\misc.accdb",3,3);
_ObjectSetProperty( g2antt , "DataSource", rs);
_ObjectSetProperty( _ObjectGetProperty( g2antt , "Items") , "AllowCellValueToItemBar", -1);
_ObjectCallMethod(g2antt, "ExecuteTemplate", "Columns.Item(2).Def(18) = 1");
_ObjectCallMethod(g2antt, "ExecuteTemplate", "Columns.Item(4).Def(18) = 2");
_ObjectCallMethod( g2antt , "EndUpdate");
|
|
1497
|
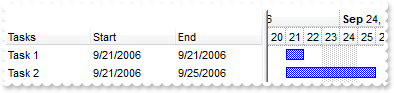
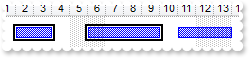
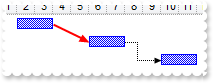
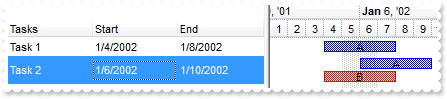
I need to specify the start and end dates of the bar to be the same, but no bars are shown. (recommended for bars with exBarKeepWorkingCount ) What I can do
OBJECT chart,columns,g2antt,items;

g2antt =  ObjectByName("AN1") ;
_ObjectCallMethod( g2antt , "BeginUpdate");
_ObjectSetProperty( g2antt , "MarkSearchColumn", 0);
columns = _ObjectGetProperty( g2antt , "Columns");
	_ObjectCallMethod( columns , "Add", "Tasks");
	_ObjectCallMethod(g2antt, "TemplatePut", "Dim colObj")
	_ObjectCallMethod(g2antt, "TemplatePut", columns)
	_ObjectCallMethod(g2antt, "ExecuteTemplate", "colObj.Add(`Start`).Def(18) = 1");
	_ObjectCallMethod(g2antt, "ExecuteTemplate", "colObj.Add(`End`).Def(18) = 543");
chart = _ObjectGetProperty( g2antt , "Chart");
	_ObjectSetProperty( chart , "FirstVisibleDate", "9/20/2006");
	_ObjectSetProperty( chart , "LevelCount", 2);
	_ObjectCallMethod(g2antt, "TemplatePut", "Dim chaObj")
	_ObjectCallMethod(g2antt, "TemplatePut", chart)
	_ObjectCallMethod(g2antt, "ExecuteTemplate", "chaObj.PaneWidth(0) = 256");
	_ObjectSetProperty( chart , "ShowEmptyBars", 0);
items = _ObjectGetProperty( g2antt , "Items");
	_ObjectSetProperty( items , "AllowCellValueToItemBar", -1);
	h = _ObjectCallMethod( items , "AddItem", "Task 1");
	_ObjectCallMethod( items , "AddBar", h,"Task","9/21/2006","9/21/2006");
	_ObjectCallMethod(g2antt, "TemplatePut", "Dim iteObj,h")
	_ObjectCallMethod(g2antt, "TemplatePut", items)
	_ObjectCallMethod(g2antt, "TemplatePut", h)
	_ObjectCallMethod(g2antt, "ExecuteTemplate", "iteObj.ItemBar(h,``,543) = ItemBar(h,``,1)");
	_ObjectCallMethod(g2antt, "ExecuteTemplate", "iteObj.ItemBar(h,``,20) = True");
	h = _ObjectCallMethod( items , "AddItem", "Task 2");
	_ObjectCallMethod( items , "AddBar", h,"Task","9/21/2006","9/21/2006");
	_ObjectCallMethod(g2antt, "ExecuteTemplate", "iteObj.ItemBar(h,``,543) = #9/25/2006#");
	_ObjectCallMethod(g2antt, "ExecuteTemplate", "iteObj.ItemBar(h,``,20) = True");
_ObjectCallMethod( g2antt , "EndUpdate");
|
|
1496
|
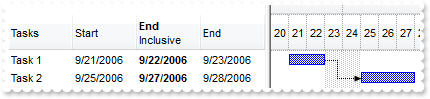
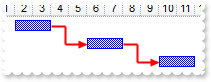
How can I display the end date to be the last visible date of task, instead the next day
// BarResize event - Occurs when a bar is moved or resized.
FUNCTION g2anttEvents_BarResize(OBJECT g2antt, INT Item, VARIANT Key)
	_ObjectCallMethod( _ObjectGetProperty( g2antt , "Items") , "SchedulePDM", Item,Key);
END

// BarResizing event - Occurs when a bar is moving or resizing.
FUNCTION g2anttEvents_BarResizing(OBJECT g2antt, INT Item, VARIANT Key)
	_ObjectCallMethod( _ObjectGetProperty( g2antt , "Items") , "SchedulePDM", Item,Key);
END

OBJECT chart,column,columns,conditionalformat,g2antt,items;

g2antt =  ObjectByName("AN1") ;
ObjectAssociateEvents("g2anttEvents", g2antt);
_ObjectCallMethod( g2antt , "BeginUpdate");
_ObjectSetProperty( g2antt , "MarkSearchColumn", 0);
_ObjectSetProperty( g2antt , "HeaderHeight", 36);
columns = _ObjectGetProperty( g2antt , "Columns");
	_ObjectCallMethod( columns , "Add", "Tasks");
	_ObjectCallMethod(g2antt, "TemplatePut", "Dim colObj")
	_ObjectCallMethod(g2antt, "TemplatePut", columns)
	_ObjectCallMethod(g2antt, "ExecuteTemplate", "colObj.Add(`Start`).Def(18) = 1");
	column = _ObjectCallMethod( columns , "Add", "End");
		_ObjectSetProperty( column , "HTMLCaption", "<b>End</b><br>Inclusive");
		_ObjectCallMethod(g2antt, "TemplatePut", "Dim colObj")
		_ObjectCallMethod(g2antt, "TemplatePut", column)
		_ObjectCallMethod(g2antt, "ExecuteTemplate", "colObj.Def(18) = 543");
		_ObjectSetProperty( _ObjectGetProperty( column , "Editor") , "EditType", 7);
	_ObjectCallMethod(g2antt, "TemplatePut", "Dim colObj")
	_ObjectCallMethod(g2antt, "TemplatePut", columns)
	_ObjectCallMethod(g2antt, "ExecuteTemplate", "colObj.Add(`End`).Def(18) = 2");
conditionalformat = _ObjectCallMethod( _ObjectGetProperty( g2antt , "ConditionalFormats") , "Add", 1);
	_ObjectSetProperty( conditionalformat , "Bold", -1);
	_ObjectSetProperty( conditionalformat , "ApplyTo", 2);
chart = _ObjectGetProperty( g2antt , "Chart");
	_ObjectSetProperty( chart , "FirstVisibleDate", "9/20/2006");
	_ObjectSetProperty( chart , "LevelCount", 2);
	_ObjectCallMethod(g2antt, "TemplatePut", "Dim chaObj")
	_ObjectCallMethod(g2antt, "TemplatePut", chart)
	_ObjectCallMethod(g2antt, "ExecuteTemplate", "chaObj.PaneWidth(0) = 256");
	_ObjectSetProperty( _ObjectCallMethod( _ObjectGetProperty( chart , "Bars") , "Add", "Task:Split") , "Shortcut", "Task");
items = _ObjectGetProperty( g2antt , "Items");
	_ObjectSetProperty( items , "AllowCellValueToItemBar", -1);
	h1 = _ObjectCallMethod( items , "AddItem", "Task 1");
	_ObjectCallMethod( items , "AddBar", h1,"Task","9/21/2006","9/23/2006");
	h2 = _ObjectCallMethod( items , "AddItem", "Task 2");
	_ObjectCallMethod( items , "AddBar", h2,"Task","9/21/2006","9/26/2006");
	_ObjectCallMethod( items , "AddLink", "link",h1,"",h2,"");
	_ObjectCallMethod(g2antt, "TemplatePut", "Dim iteObj")
	_ObjectCallMethod(g2antt, "TemplatePut", items)
	_ObjectCallMethod(g2antt, "ExecuteTemplate", "iteObj.ItemBar(0,`<*>`,20) = True");
	_ObjectCallMethod( items , "SchedulePDM", 0,"");
_ObjectCallMethod( g2antt , "EndUpdate");
|
|
1495
|
How do I hide the selection
OBJECT column,columns,g2antt,items;

g2antt =  ObjectByName("AN1") ;
_ObjectCallMethod( g2antt , "BeginUpdate");
_ObjectSetProperty( g2antt , "MarkSearchColumn", 0);
_ObjectSetProperty( g2antt , "SelForeColor", _ObjectGetProperty( g2antt , "ForeColor"));
_ObjectSetProperty( g2antt , "SelBackColor", _ObjectGetProperty( g2antt , "BackColor"));
_ObjectSetProperty( g2antt , "ShowFocusRect", 0);
columns = _ObjectGetProperty( g2antt , "Columns");
	column = _ObjectCallMethod( columns , "Add", "Format");
		_ObjectSetProperty( column , "FormatColumn", "type(value) in (0,1) ? 'null' : ( dbl(value)<0 ? '<fgcolor=FF0000>'+ (value format '2|.|3|,|1' ) : (dbl(value)>0 ? '<fgcolor=00" +
	"00FF>+'+(value format '2|.|3|,' ): '0.00') )");
		_ObjectCallMethod(g2antt, "TemplatePut", "Dim colObj")
		_ObjectCallMethod(g2antt, "TemplatePut", column)
		_ObjectCallMethod(g2antt, "ExecuteTemplate", "colObj.Def(17) = 1");
items = _ObjectGetProperty( g2antt , "Items");
	_ObjectCallMethod( items , "AddItem", 10);
	_ObjectCallMethod( items , "AddItem", -8);
_ObjectCallMethod( g2antt , "EndUpdate");
|
|
1494
|
How do I access the cells, or how do I get the values in the columns
OBJECT columns,g2antt,items;

g2antt =  ObjectByName("AN1") ;
columns = _ObjectGetProperty( g2antt , "Columns");
	_ObjectCallMethod( columns , "Add", "C1");
	_ObjectCallMethod( columns , "Add", "C2");
	_ObjectCallMethod( columns , "Add", "C3");
items = _ObjectGetProperty( g2antt , "Items");
	h = _ObjectCallMethod( items , "AddItem", "Item 1");
	_ObjectCallMethod(g2antt, "TemplatePut", "Dim iteObj,h")
	_ObjectCallMethod(g2antt, "TemplatePut", items)
	_ObjectCallMethod(g2antt, "TemplatePut", h)
	_ObjectCallMethod(g2antt, "ExecuteTemplate", "iteObj.CellValue(h,1) = `SubItem 1.1`");
	_ObjectCallMethod(g2antt, "ExecuteTemplate", "iteObj.CellValue(h,2) = `SubItem 1.2`");
	Message( _ObjectCallMethod(g2antt, "ExecuteTemplate", "iteObj.CellValue(h,1)") );
|
|
1493
|
Is there any function I can use to indicate the Now() when using the ComputedFields, CondtionalFormats, ...
OBJECT g2antt;

g2antt =  ObjectByName("AN1") ;
_ObjectSetProperty( _ObjectCallMethod( _ObjectGetProperty( g2antt , "Columns") , "Add", "Now") , "ComputedField", "date(``)");
_ObjectCallMethod( _ObjectGetProperty( g2antt , "Items") , "AddItem", "");
|
|
1492
|
How can I get the start and end points of the bar once the BarResize event occurs
// BarResize event - Occurs when a bar is moved or resized.
FUNCTION g2anttEvents_BarResize(OBJECT g2antt, INT Item, VARIANT Key)
	_ObjectCallMethod(g2antt, "TemplatePut", "Dim _ObObj,Item,Key")
	_ObjectCallMethod(g2antt, "TemplatePut", _ObjectGetProperty( g2antt , "Items"))
	_ObjectCallMethod(g2antt, "TemplatePut", Item)
	_ObjectCallMethod(g2antt, "TemplatePut", Key)
	Message( "Start: " );
	Message( _ObjectCallMethod(g2antt, "ExecuteTemplate", "_ObObj.ItemBar(Item,Key,1)") );
	Message( "End: " );
	Message( _ObjectCallMethod(g2antt, "ExecuteTemplate", "_ObObj.ItemBar(Item,Key,2)") );
END

OBJECT chart,g2antt,items;

g2antt =  ObjectByName("AN1") ;
ObjectAssociateEvents("g2anttEvents", g2antt);
_ObjectCallMethod( g2antt , "BeginUpdate");
chart = _ObjectGetProperty( g2antt , "Chart");
	_ObjectSetProperty( chart , "FirstVisibleDate", "12/31/2009");
	_ObjectSetProperty( chart , "LevelCount", 2);
	_ObjectCallMethod(g2antt, "TemplatePut", "Dim chaObj")
	_ObjectCallMethod(g2antt, "TemplatePut", chart)
	_ObjectCallMethod(g2antt, "ExecuteTemplate", "chaObj.PaneWidth(False) = 96");
	_ObjectCallMethod(g2antt, "TemplatePut", "Dim _ObObj")
	_ObjectCallMethod(g2antt, "TemplatePut", _ObjectGetProperty( chart , "Bars"))
	var_Bar = _ObjectCallMethod(g2antt, "ExecuteTemplate", "_ObObj.Item(`Task`)");
_ObjectCallMethod( _ObjectGetProperty( g2antt , "Columns") , "Add", "Types");
items = _ObjectGetProperty( g2antt , "Items");
	_ObjectCallMethod( items , "AddBar", _ObjectCallMethod( items , "AddItem", "Task 1"),"Task","1/4/2010","1/9/2010","");
	_ObjectCallMethod( items , "AddBar", _ObjectCallMethod( items , "AddItem", "Task 2"),"Task","1/4/2010","1/9/2010","");
_ObjectCallMethod( g2antt , "EndUpdate");
|
|
1491
|
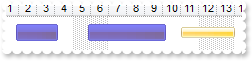
My chart displays hours, the question would be if possible to let user resizes the bars up to 1/2 hour, or a half an hour
OBJECT chart,g2antt,items;

g2antt =  ObjectByName("AN1") ;
_ObjectCallMethod( g2antt , "BeginUpdate");
_ObjectSetProperty( g2antt , "DefaultItemHeight", 22);
_ObjectCallMethod( _ObjectGetProperty( g2antt , "Columns") , "Add", "Task");
chart = _ObjectGetProperty( g2antt , "Chart");
	_ObjectSetProperty( chart , "AllowCreateBar", 1);
	_ObjectSetProperty( chart , "LevelCount", 2);
	_ObjectSetProperty( chart , "UnitScale", 65536);
	_ObjectSetProperty( chart , "ResizeUnitScale", 1048576);
	_ObjectSetProperty( chart , "ResizeUnitCount", 30);
	_ObjectCallMethod(g2antt, "TemplatePut", "Dim chaObj")
	_ObjectCallMethod(g2antt, "TemplatePut", chart)
	_ObjectCallMethod(g2antt, "ExecuteTemplate", "chaObj.PaneWidth(False) = 48");
	_ObjectSetProperty( chart , "FirstVisibleDate", "1/1/2001");
	_ObjectSetProperty( chart , "DrawGridLines", -1);
	_ObjectCallMethod(g2antt, "ExecuteTemplate", "chaObj.Level(1).DrawGridLines = -1");
items = _ObjectGetProperty( g2antt , "Items");
	_ObjectCallMethod( items , "AddItem", "Task");
	_ObjectCallMethod( items , "AddItem", "Task");
	_ObjectCallMethod( items , "AddItem", "Task");
	_ObjectCallMethod( items , "AddItem", "Task");
	_ObjectCallMethod( items , "AddItem", "Task");
_ObjectCallMethod( g2antt , "EndUpdate");
|
|
1490
|
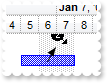
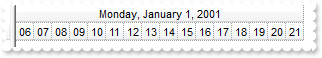
How can I show the dates in the title
OBJECT chart,g2antt;

g2antt =  ObjectByName("AN1") ;
_ObjectCallMethod( g2antt , "BeginUpdate");
chart = _ObjectGetProperty( g2antt , "Chart");
	_ObjectSetProperty( chart , "FirstVisibleDate", "12/30/2002");
	_ObjectSetProperty( chart , "LevelCount", 2);
	_ObjectCallMethod(g2antt, "TemplatePut", "Dim chaObj")
	_ObjectCallMethod(g2antt, "TemplatePut", chart)
	_ObjectCallMethod(g2antt, "ExecuteTemplate", "chaObj.PaneWidth(False) = 0");
	_ObjectSetProperty( chart , "UnitScale", 65536);
	_ObjectSetProperty( chart , "DrawGridLines", -1);
	_ObjectCallMethod(g2antt, "ExecuteTemplate", "chaObj.Level(0).Alignment = 17");
_ObjectCallMethod( g2antt , "EndUpdate");
|
|
1489
|
If I vertically scroll the control the image flows fluently. But when I scroll on the horizontal chart's scrollbar the images only shows after I release the click button. Can I make it scroll fluently like the vertical scrollbar
OBJECT g2antt;

g2antt =  ObjectByName("AN1") ;
_ObjectCallMethod(g2antt, "ExecuteTemplate", "Chart.PaneWidth(False) = 0");
_ObjectSetProperty( _ObjectGetProperty( g2antt , "Chart") , "ToolTip", "");
|
|
1488
|
How can I programmatically add a bar during the CreateBar event
// CreateBar event - Fired when the user creates a new bar.
FUNCTION g2anttEvents_CreateBar(OBJECT g2antt, INT Item, REAL DateStart, REAL DateEnd)
	OBJECT items;
	items = _ObjectGetProperty( g2antt , "Items");
		_ObjectCallMethod(g2antt, "TemplatePut", "Dim iteObj,Item")
		_ObjectCallMethod(g2antt, "TemplatePut", items)
		_ObjectCallMethod(g2antt, "TemplatePut", Item)
		k = _ObjectCallMethod(g2antt, "ExecuteTemplate", "iteObj.ItemBar(Item,``,256)");
		_ObjectCallMethod( items , "AddBar", Item,"Order",DateStart,DateEnd,k,"your text");
	_ObjectCallMethod(g2antt, "TemplatePut", "Dim _ObObj,Item")
	_ObjectCallMethod(g2antt, "TemplatePut", _ObjectGetProperty( g2antt , "Items"))
	_ObjectCallMethod(g2antt, "TemplatePut", Item)
	Message( _ObjectCallMethod(g2antt, "ExecuteTemplate", "_ObObj.ItemBar(Item,``,256)") );
END

OBJECT chart,g2antt,items;

g2antt =  ObjectByName("AN1") ;
ObjectAssociateEvents("g2anttEvents", g2antt);
_ObjectCallMethod( g2antt , "BeginUpdate");
_ObjectCallMethod( _ObjectGetProperty( g2antt , "Columns") , "Add", "Tasks");
chart = _ObjectGetProperty( g2antt , "Chart");
	_ObjectSetProperty( chart , "AllowCreateBar", -1);
	_ObjectCallMethod(g2antt, "TemplatePut", "Dim chaObj")
	_ObjectCallMethod(g2antt, "TemplatePut", chart)
	_ObjectCallMethod(g2antt, "ExecuteTemplate", "chaObj.PaneWidth(False) = 48");
	_ObjectSetProperty( chart , "FirstVisibleDate", "12/28/2000");
	_ObjectSetProperty( chart , "LevelCount", 2);
	_ObjectCallMethod( _ObjectGetProperty( chart , "Bars") , "Copy", "Task","Order");
items = _ObjectGetProperty( g2antt , "Items");
	_ObjectCallMethod( items , "AddItem", 1);
	_ObjectCallMethod( items , "AddItem", 2);
	_ObjectCallMethod( items , "AddItem", 3);
_ObjectCallMethod( g2antt , "EndUpdate");
|
|
1487
|
How can I move more bars by code
OBJECT chart,g2antt,items;

g2antt =  ObjectByName("AN1") ;
_ObjectCallMethod( _ObjectGetProperty( g2antt , "Columns") , "Add", "Tasks");
chart = _ObjectGetProperty( g2antt , "Chart");
	_ObjectSetProperty( chart , "FirstVisibleDate", "1/1/2001");
	_ObjectSetProperty( chart , "LevelCount", 2);
	_ObjectCallMethod(g2antt, "TemplatePut", "Dim chaObj")
	_ObjectCallMethod(g2antt, "TemplatePut", chart)
	_ObjectCallMethod(g2antt, "ExecuteTemplate", "chaObj.PaneWidth(False) = 48");
items = _ObjectGetProperty( g2antt , "Items");
	_ObjectCallMethod( items , "AddBar", _ObjectCallMethod( items , "AddItem", "Task 1"),"Task","1/1/2001","1/6/2001","A");
	_ObjectCallMethod( items , "AddBar", _ObjectCallMethod( items , "AddItem", "Task 2"),"Task","1/2/2001","1/7/2001","B");
	_ObjectCallMethod(g2antt, "TemplatePut", "Dim iteObj")
	_ObjectCallMethod(g2antt, "TemplatePut", items)
	_ObjectCallMethod(g2antt, "ExecuteTemplate", "iteObj.ItemBar(0,`<*>`,514) = 1");
	_ObjectCallMethod(g2antt, "ExecuteTemplate", "iteObj.ItemBar(0,`<A*>`,514) = 1");
	_ObjectCallMethod(g2antt, "ExecuteTemplate", "iteObj.ItemBar(0,`<B*>`,514) = 1");
|
|
1486
|
How can I move a bar by code
OBJECT chart,g2antt,items;

g2antt =  ObjectByName("AN1") ;
_ObjectCallMethod( _ObjectGetProperty( g2antt , "Columns") , "Add", "Tasks");
chart = _ObjectGetProperty( g2antt , "Chart");
	_ObjectSetProperty( chart , "FirstVisibleDate", "1/1/2001");
	_ObjectSetProperty( chart , "LevelCount", 2);
	_ObjectCallMethod(g2antt, "TemplatePut", "Dim chaObj")
	_ObjectCallMethod(g2antt, "TemplatePut", chart)
	_ObjectCallMethod(g2antt, "ExecuteTemplate", "chaObj.PaneWidth(False) = 48");
items = _ObjectGetProperty( g2antt , "Items");
	h = _ObjectCallMethod( items , "AddItem", "Task 1");
	_ObjectCallMethod( items , "AddBar", h,"Task","1/1/2001","1/6/2001","A");
	_ObjectCallMethod(g2antt, "TemplatePut", "Dim iteObj,h")
	_ObjectCallMethod(g2antt, "TemplatePut", items)
	_ObjectCallMethod(g2antt, "TemplatePut", h)
	_ObjectCallMethod(g2antt, "ExecuteTemplate", "iteObj.ItemBar(h,`A`,514) = 1");
|
|
1485
|
How can I clip the notes to the items zone only
OBJECT chart,g2antt,items,note,notes;

g2antt =  ObjectByName("AN1") ;
_ObjectCallMethod( g2antt , "BeginUpdate");
_ObjectCallMethod( g2antt , "Images", "gBJJgBAIDAAGAAEAAQhYAf8Pf4hh0QihCJo2AEZjQAjEZFEaIEaEEaAIAkcbk0olUrlktl0vmExmUzmk1m03nE5nU7nk9n0/oFBoVDolFo1HpFJpVLplNp1PqFRqVTq" +
	"lVq1XrFZrVbrldr1fsFhsVjslls1ntFptVrtltt1vuFxuVzul1u13vF5vV7vl9v1/wGBwWDwmFw2HxGJxWLxmNx0xiFdyOTh8Tf9ZymXx+QytcyNgz8r0OblWjyWds+m" +
	"0ka1Vf1ta1+r1mos2xrG2xeZ0+a0W0qOx3GO4NV3WeyvD2XJ5XL5nN51aiw+lfSj0gkUkAEllHanHI5j/cHg8EZf7w8vl8j4f/qfEZeB09/vjLAB30+kZQAP/P5/H6/y" +
	"NAOAEAwCjMBwFAEDwJBMDwLBYAP2/8Hv8/gAGAD8LQs9w/nhDY/oygIA=");
_ObjectSetProperty( g2antt , "AntiAliasing", -1);
_ObjectCallMethod( _ObjectGetProperty( g2antt , "Columns") , "Add", "Task");
chart = _ObjectGetProperty( g2antt , "Chart");
	_ObjectSetProperty( chart , "FirstVisibleDate", "1/1/2001");
	_ObjectCallMethod(g2antt, "TemplatePut", "Dim chaObj")
	_ObjectCallMethod(g2antt, "TemplatePut", chart)
	_ObjectCallMethod(g2antt, "ExecuteTemplate", "chaObj.PaneWidth(False) = 96");
	_ObjectSetProperty( chart , "LevelCount", 2);
items = _ObjectGetProperty( g2antt , "Items");
	_ObjectCallMethod( items , "AddItem", );
	h = _ObjectCallMethod( items , "AddItem", "Task 1");
	_ObjectCallMethod( items , "AddBar", h,"Task","1/5/2001","1/8/2001","1");
notes = _ObjectGetProperty( _ObjectGetProperty( g2antt , "Chart") , "Notes");
	note = _ObjectCallMethod( notes , "Add", "1",_ObjectCallMethod(g2antt, "ExecuteTemplate", ".Items.ItemByIndex(1)"),"1","<img>2</img>");
		_ObjectCallMethod(g2antt, "TemplatePut", "Dim notObj")
		_ObjectCallMethod(g2antt, "TemplatePut", note)
		_ObjectCallMethod(g2antt, "ExecuteTemplate", "notObj.PartShadow(1) = False");
		_ObjectCallMethod(g2antt, "ExecuteTemplate", "notObj.PartBorderSize(1) = 0");
		_ObjectCallMethod( note , "ClearPartBackColor", 1);
		_ObjectCallMethod(g2antt, "ExecuteTemplate", "notObj.PartCanMove(1) = True");
		_ObjectSetProperty( note , "RelativePosition", 0.5);
		_ObjectCallMethod(g2antt, "ExecuteTemplate", "notObj.PartVOffset(1) = -36");
	_ObjectSetProperty( notes , "ClipTo", 2);
_ObjectCallMethod( g2antt , "EndUpdate");
|
|
1484
|
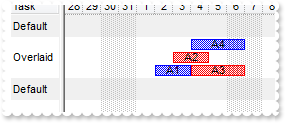
How can I put two bars of various types, in the event of conflict do not coincide
OBJECT bar,chart,g2antt,items;

g2antt =  ObjectByName("AN1") ;
_ObjectCallMethod( g2antt , "BeginUpdate");
_ObjectSetProperty( g2antt , "DefaultItemHeight", 22);
_ObjectCallMethod( _ObjectGetProperty( g2antt , "Columns") , "Add", "Task");
_ObjectSetProperty( g2antt , "ScrollBySingleLine", -1);
_ObjectSetProperty( g2antt , "BackColorAlternate", 15790320);
chart = _ObjectGetProperty( g2antt , "Chart");
	_ObjectCallMethod(g2antt, "TemplatePut", "Dim chaObj")
	_ObjectCallMethod(g2antt, "TemplatePut", chart)
	_ObjectCallMethod(g2antt, "ExecuteTemplate", "chaObj.PaneWidth(False) = 48");
	_ObjectSetProperty( chart , "FirstVisibleDate", "12/28/2000");
	_ObjectSetProperty( chart , "LevelCount", 2);
	bar = _ObjectCallMethod(g2antt, "ExecuteTemplate", "chaObj.Bars.Item(`Task`)");
		_ObjectSetProperty( bar , "OverlaidType", 515);
		_ObjectSetProperty( bar , "OverlaidGroup", "NewTask");
	bar = _ObjectCallMethod( _ObjectGetProperty( chart , "Bars") , "Copy", "Task","NewTask");
		_ObjectSetProperty( bar , "OverlaidType", 515);
		_ObjectSetProperty( bar , "OverlaidGroup", "Task");
		_ObjectSetProperty( bar , "Color", 255);
items = _ObjectGetProperty( g2antt , "Items");
	h1 = _ObjectCallMethod( items , "AddItem", "Default");
	h = _ObjectCallMethod( items , "AddItem", "Overlaid");
	_ObjectCallMethod( items , "AddBar", h,"Task","1/2/2001","1/4/2001","A1","A1");
	_ObjectCallMethod( items , "AddBar", h,"NewTask","1/3/2001","1/5/2001","A2","A2");
	_ObjectCallMethod( items , "AddBar", h,"NewTask","1/4/2001","1/7/2001","A3","A3");
	_ObjectCallMethod( items , "AddBar", h,"Task","1/4/2001","1/7/2001","A4","A4");
	h1 = _ObjectCallMethod( items , "AddItem", "Default");
_ObjectCallMethod( g2antt , "EndUpdate");
|
|
1483
|
How can I run trigger an event which, after clicking on the item/bar gives the key/name or item id
// MouseDown event - Occurs when the user presses a mouse button.
FUNCTION g2anttEvents_MouseDown(OBJECT g2antt, INT Button, INT Shift, INT X, INT Y)
	_ObjectCallMethod(g2antt, "TemplatePut", "Dim column,hit")
	_ObjectCallMethod(g2antt, "TemplatePut", column)
	_ObjectCallMethod(g2antt, "TemplatePut", hit)
	item = _ObjectCallMethod(g2antt, "ExecuteTemplate", "ItemFromPoint(-1,-1,column,hit)");
	_ObjectCallMethod(g2antt, "TemplatePut", "Dim _ObObj")
	_ObjectCallMethod(g2antt, "TemplatePut", _ObjectGetProperty( g2antt , "Chart"))
	key = _ObjectCallMethod(g2antt, "ExecuteTemplate", "_ObObj.BarFromPoint(-1,-1)");
	Message( "Item:" );
	Message( item );
	Message( "Key:" );
	Message( key );
	_ObjectCallMethod(g2antt, "TemplatePut", "Dim _ObObj,item")
	_ObjectCallMethod(g2antt, "TemplatePut", _ObjectGetProperty( g2antt , "Items"))
	_ObjectCallMethod(g2antt, "TemplatePut", item)
	Message( "CellValue(i,0):" );
	Message( _ObjectCallMethod(g2antt, "ExecuteTemplate", "_ObObj.CellValue(item,0)") );
	_ObjectCallMethod(g2antt, "TemplatePut", "Dim item,key")
	_ObjectCallMethod(g2antt, "TemplatePut", item)
	_ObjectCallMethod(g2antt, "TemplatePut", key)
	_ObjectCallMethod(g2antt, "ExecuteTemplate", "Items.ItemBar(item,key,33) = 255");
END

OBJECT chart,g2antt,items;

g2antt =  ObjectByName("AN1") ;
ObjectAssociateEvents("g2anttEvents", g2antt);
_ObjectCallMethod( g2antt , "BeginUpdate");
_ObjectCallMethod( _ObjectGetProperty( g2antt , "Columns") , "Add", "Task");
chart = _ObjectGetProperty( g2antt , "Chart");
	_ObjectSetProperty( chart , "FirstVisibleDate", "12/29/2000");
	_ObjectCallMethod(g2antt, "TemplatePut", "Dim chaObj")
	_ObjectCallMethod(g2antt, "TemplatePut", chart)
	_ObjectCallMethod(g2antt, "ExecuteTemplate", "chaObj.PaneWidth(False) = 64");
	_ObjectSetProperty( chart , "LevelCount", 2);
items = _ObjectGetProperty( g2antt , "Items");
	h1 = _ObjectCallMethod( items , "AddItem", "Task 1");
	_ObjectCallMethod( items , "AddBar", h1,"Task","1/2/2001","1/4/2001","K1");
	h2 = _ObjectCallMethod( items , "AddItem", "Task 2");
	_ObjectCallMethod( items , "AddBar", h2,"Task","1/4/2001","1/6/2001","K2");
	_ObjectCallMethod( items , "AddLink", "L1",h1,"K1",h2,"K2");
	h3 = _ObjectCallMethod( items , "AddItem", "Task 3");
	_ObjectCallMethod( items , "AddBar", h3,"Task","1/8/2001","1/10/2001","K3");
	_ObjectCallMethod( items , "AddLink", "L2",h2,"K2",h3,"K3");
_ObjectCallMethod( g2antt , "EndUpdate");
|
|
1482
|
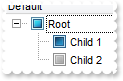
How can I change the check-boxes appearance
OBJECT appearance,column,g2antt,items;

g2antt =  ObjectByName("AN1") ;
_ObjectSetProperty( g2antt , "LinesAtRoot", -1);
column = _ObjectCallMethod( _ObjectGetProperty( g2antt , "Columns") , "Add", "Default");
	_ObjectCallMethod(g2antt, "TemplatePut", "Dim colObj")
	_ObjectCallMethod(g2antt, "TemplatePut", column)
	_ObjectCallMethod(g2antt, "ExecuteTemplate", "colObj.Def(0) = True");
	_ObjectSetProperty( column , "PartialCheck", -1);
items = _ObjectGetProperty( g2antt , "Items");
	h = _ObjectCallMethod( items , "AddItem", "Root");
	_ObjectCallMethod( items , "InsertItem", h,"","Child 1");
	_ObjectCallMethod( items , "InsertItem", h,"","Child 2");
	_ObjectCallMethod(g2antt, "TemplatePut", "Dim iteObj,h")
	_ObjectCallMethod(g2antt, "TemplatePut", items)
	_ObjectCallMethod(g2antt, "TemplatePut", h)
	_ObjectCallMethod(g2antt, "ExecuteTemplate", "iteObj.ExpandItem(h) = True");
appearance = _ObjectGetProperty( g2antt , "VisualAppearance");
	_ObjectCallMethod( appearance , "Add", 1,"XP:Button 3 12");
	_ObjectCallMethod( appearance , "Add", 2,"XP:Button 3 11");
	_ObjectCallMethod( appearance , "Add", 3,"XP:Button 3 10");
_ObjectCallMethod(g2antt, "ExecuteTemplate", "CheckImage(0) = 16777216");
_ObjectCallMethod(g2antt, "ExecuteTemplate", "CheckImage(1) = 33554432");
_ObjectCallMethod(g2antt, "ExecuteTemplate", "CheckImage(2) = 50331648");
|
|
1481
|
How can I change the color for the control's split bar (sample 1)
OBJECT chart,g2antt;

g2antt =  ObjectByName("AN1") ;
_ObjectCallMethod( g2antt , "BeginUpdate");
_ObjectCallMethod( _ObjectGetProperty( g2antt , "Columns") , "Add", "Default");
_ObjectCallMethod(g2antt, "ExecuteTemplate", "Background(18) = 65536");
_ObjectSetProperty( g2antt , "BackColorLevelHeader", _ObjectGetProperty( g2antt , "BackColor"));
chart = _ObjectGetProperty( g2antt , "Chart");
	_ObjectSetProperty( chart , "LevelCount", 2);
	_ObjectCallMethod(g2antt, "TemplatePut", "Dim chaObj")
	_ObjectCallMethod(g2antt, "TemplatePut", chart)
	_ObjectCallMethod(g2antt, "ExecuteTemplate", "chaObj.PaneWidth(False) = 64");
	_ObjectSetProperty( chart , "HistogramVisible", -1);
	_ObjectSetProperty( chart , "HistogramHeight", 64);
	_ObjectSetProperty( chart , "OverviewHeight", 48);
	_ObjectSetProperty( chart , "OverviewVisible", -1);
_ObjectCallMethod( g2antt , "EndUpdate");
|
|
1480
|
Is it possible to display ONLY the working hours
OBJECT chart,g2antt,level;

g2antt =  ObjectByName("AN1") ;
chart = _ObjectGetProperty( g2antt , "Chart");
	_ObjectSetProperty( chart , "FirstVisibleDate", "1/1/2001");
	_ObjectSetProperty( chart , "LevelCount", 2);
	level = _ObjectCallMethod(g2antt, "ExecuteTemplate", "chaObj.Level(0)");
		_ObjectSetProperty( level , "Label", 4096);
		_ObjectSetProperty( level , "Alignment", 17);
	level = _ObjectCallMethod(g2antt, "ExecuteTemplate", "chaObj.Level(1)");
		_ObjectSetProperty( level , "Label", "<%hh%>");
		_ObjectSetProperty( level , "Count", 6);
	_ObjectSetProperty( chart , "UnitWidth", 26);
	_ObjectCallMethod(g2antt, "TemplatePut", "Dim chaObj")
	_ObjectCallMethod(g2antt, "TemplatePut", chart)
	_ObjectCallMethod(g2antt, "ExecuteTemplate", "chaObj.PaneWidth(False) = 0");
	_ObjectSetProperty( chart , "NonworkingHours", 15728895);
	_ObjectSetProperty( chart , "ShowNonworkingUnits", 0);
	_ObjectSetProperty( chart , "ShowNonworkingHours", 0);
|
|
1479
|
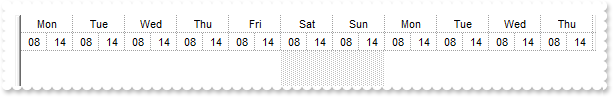
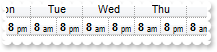
How can I display the end of the day in the chart's header
OBJECT chart,g2antt,level;

g2antt =  ObjectByName("AN1") ;
chart = _ObjectGetProperty( g2antt , "Chart");
	_ObjectSetProperty( chart , "FirstVisibleDate", "1/1/2001");
	_ObjectSetProperty( chart , "LevelCount", 2);
	level = _ObjectCallMethod(g2antt, "ExecuteTemplate", "chaObj.Level(0)");
		_ObjectSetProperty( level , "Label", 4096);
		_ObjectSetProperty( level , "Alignment", 17);
	level = _ObjectCallMethod(g2antt, "ExecuteTemplate", "chaObj.Level(1)");
		_ObjectSetProperty( level , "Label", "<%hh%>");
		_ObjectSetProperty( level , "Count", 6);
		_ObjectCallMethod(g2antt, "TemplatePut", "Dim levObj")
		_ObjectCallMethod(g2antt, "TemplatePut", level)
		_ObjectCallMethod(g2antt, "ExecuteTemplate", "levObj.ReplaceLabel(`08`) = `<b>8</b> <font ;6>am`");
		_ObjectCallMethod(g2antt, "ExecuteTemplate", "levObj.ReplaceLabel(`14`) = `<b>8</b> <font ;6>pm`");
	_ObjectSetProperty( chart , "UnitWidth", 26);
	_ObjectCallMethod(g2antt, "TemplatePut", "Dim chaObj")
	_ObjectCallMethod(g2antt, "TemplatePut", chart)
	_ObjectCallMethod(g2antt, "ExecuteTemplate", "chaObj.PaneWidth(False) = 0");
	_ObjectSetProperty( chart , "NonworkingHours", 15728895);
	_ObjectSetProperty( chart , "ShowNonworkingUnits", 0);
	_ObjectSetProperty( chart , "ShowNonworkingHours", 0);
|
|
1478
|
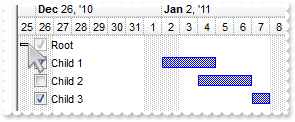
How can I display the +/- expanding buttons in the chart section
OBJECT chart,column,g2antt,items;

g2antt =  ObjectByName("AN1") ;
_ObjectCallMethod( g2antt , "BeginUpdate");
_ObjectSetProperty( g2antt , "LinesAtRoot", -1);
_ObjectSetProperty( g2antt , "Indent", 13);
_ObjectSetProperty( g2antt , "HasButtons", 3);
chart = _ObjectGetProperty( g2antt , "Chart");
	_ObjectSetProperty( chart , "FirstVisibleDate", "12/25/2010");
	_ObjectSetProperty( chart , "LevelCount", 2);
	_ObjectCallMethod(g2antt, "TemplatePut", "Dim chaObj")
	_ObjectCallMethod(g2antt, "TemplatePut", chart)
	_ObjectCallMethod(g2antt, "ExecuteTemplate", "chaObj.PaneWidth(False) = 0");
	_ObjectSetProperty( chart , "ColumnsFormatLevel", "0");
	_ObjectSetProperty( chart , "SelBackColor", _ObjectGetProperty( g2antt , "SelBackColor"));
	_ObjectSetProperty( chart , "SelForeColor", _ObjectGetProperty( g2antt , "SelForeColor"));
column = _ObjectCallMethod( _ObjectGetProperty( g2antt , "Columns") , "Add", "P1");
	_ObjectCallMethod(g2antt, "TemplatePut", "Dim colObj")
	_ObjectCallMethod(g2antt, "TemplatePut", column)
	_ObjectCallMethod(g2antt, "ExecuteTemplate", "colObj.Def(0) = True");
	_ObjectSetProperty( column , "PartialCheck", -1);
items = _ObjectGetProperty( g2antt , "Items");
	h = _ObjectCallMethod( items , "AddItem", "Root");
	_ObjectCallMethod( items , "AddBar", _ObjectCallMethod( items , "InsertItem", h,"","Child 1"),"Task","1/2/2011","1/5/2011");
	_ObjectCallMethod( items , "AddBar", _ObjectCallMethod( items , "InsertItem", h,"","Child 2"),"Task","1/4/2011","1/7/2011");
	_ObjectCallMethod( items , "AddBar", _ObjectCallMethod( items , "InsertItem", h,"","Child 3"),"Task","1/7/2011","1/8/2011");
	_ObjectCallMethod(g2antt, "TemplatePut", "Dim iteObj,h")
	_ObjectCallMethod(g2antt, "TemplatePut", items)
	_ObjectCallMethod(g2antt, "TemplatePut", h)
	_ObjectCallMethod(g2antt, "ExecuteTemplate", "iteObj.ExpandItem(h) = True");
_ObjectCallMethod( g2antt , "EndUpdate");
|
|
1477
|
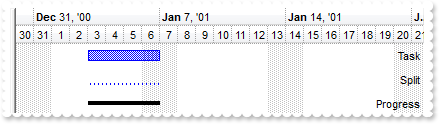
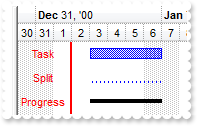
Is it possible to display the columns in the chart aligned to the right
OBJECT chart,column,g2antt,items;
g2antt = ObjectByName("AN1") ;
_ObjectCallMethod( g2antt , "BeginUpdate");
_ObjectSetProperty( g2antt , "DefaultItemHeight", 24);
_ObjectCallMethod( _ObjectGetProperty( g2antt , "Columns") , "Add", "Tasks");
column = _ObjectCallMethod( _ObjectGetProperty( g2antt , "Columns") , "Add", "Key");
_ObjectCallMethod(g2antt, "TemplatePut", "Dim colObj")
_ObjectCallMethod(g2antt, "TemplatePut", column)
_ObjectCallMethod(g2antt, "ExecuteTemplate", "colObj.Def(18) = 0");
_ObjectSetProperty( column , "Visible", 0);
_ObjectSetProperty( column , "Alignment", 2);
chart = _ObjectGetProperty( g2antt , "Chart");
_ObjectSetProperty( chart , "FirstVisibleDate", "12/30/2000");
_ObjectSetProperty( chart , "LevelCount", 2);
_ObjectCallMethod(g2antt, "TemplatePut", "Dim chaObj")
_ObjectCallMethod(g2antt, "TemplatePut", chart)
_ObjectCallMethod(g2antt, "ExecuteTemplate", "chaObj.PaneWidth(False) = 0");
_ObjectSetProperty( chart , "ColumnsFormatLevel", "|,1:52");
items = _ObjectGetProperty( g2antt , "Items");
_ObjectSetProperty( items , "AllowCellValueToItemBar", -1);
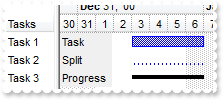
_ObjectCallMethod( items , "AddBar", _ObjectCallMethod( items , "AddItem", "Task 1"),"Task","1/3/2001","1/7/2001");
_ObjectCallMethod( items , "AddBar", _ObjectCallMethod( items , "AddItem", "Task 2"),"Split","1/3/2001","1/7/2001");
_ObjectCallMethod( items , "AddBar", _ObjectCallMethod( items , "AddItem", "Task 3"),"Progress","1/3/2001","1/7/2001");
_ObjectCallMethod( g2antt , "EndUpdate");
|
|
1476
|
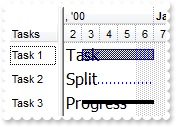
How can I display a border in the chart
OBJECT chart,column,g2antt,items;

g2antt =  ObjectByName("AN1") ;
_ObjectCallMethod( g2antt , "BeginUpdate");
_ObjectSetProperty( g2antt , "DefaultItemHeight", 24);
_ObjectCallMethod( _ObjectGetProperty( g2antt , "Columns") , "Add", "Tasks");
column = _ObjectCallMethod( _ObjectGetProperty( g2antt , "Columns") , "Add", "Key");
	_ObjectCallMethod(g2antt, "TemplatePut", "Dim colObj")
	_ObjectCallMethod(g2antt, "TemplatePut", column)
	_ObjectCallMethod(g2antt, "ExecuteTemplate", "colObj.Def(18) = 0");
	_ObjectSetProperty( column , "Visible", 0);
	_ObjectSetProperty( column , "Alignment", 1);
	_ObjectCallMethod(g2antt, "ExecuteTemplate", "colObj.Def(5) = 255");
chart = _ObjectGetProperty( g2antt , "Chart");
	_ObjectSetProperty( chart , "FirstVisibleDate", "12/30/2000");
	_ObjectSetProperty( chart , "LevelCount", 2);
	_ObjectCallMethod(g2antt, "TemplatePut", "Dim chaObj")
	_ObjectCallMethod(g2antt, "TemplatePut", chart)
	_ObjectCallMethod(g2antt, "ExecuteTemplate", "chaObj.PaneWidth(False) = 0");
	_ObjectSetProperty( chart , "ColumnsFormatLevel", "1:52,\^"\^"[bg=255]:2");
items = _ObjectGetProperty( g2antt , "Items");
	_ObjectSetProperty( items , "AllowCellValueToItemBar", -1);
	_ObjectCallMethod( items , "AddBar", _ObjectCallMethod( items , "AddItem", "Task 1"),"Task","1/3/2001","1/7/2001");
	_ObjectCallMethod( items , "AddBar", _ObjectCallMethod( items , "AddItem", "Task 2"),"Split","1/3/2001","1/7/2001");
	_ObjectCallMethod( items , "AddBar", _ObjectCallMethod( items , "AddItem", "Task 3"),"Progress","1/3/2001","1/7/2001");
_ObjectCallMethod( g2antt , "EndUpdate");
|
|
1475
|
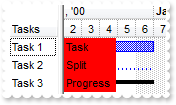
How can I change the font to display the columns in the chart (Method 2)
OBJECT chart,column,conditionalformat,g2antt,items;

g2antt =  ObjectByName("AN1") ;
_ObjectCallMethod( g2antt , "BeginUpdate");
_ObjectSetProperty( g2antt , "DefaultItemHeight", 24);
_ObjectCallMethod( _ObjectGetProperty( g2antt , "Columns") , "Add", "Tasks");
column = _ObjectCallMethod( _ObjectGetProperty( g2antt , "Columns") , "Add", "Key");
	_ObjectCallMethod(g2antt, "TemplatePut", "Dim colObj")
	_ObjectCallMethod(g2antt, "TemplatePut", column)
	_ObjectCallMethod(g2antt, "ExecuteTemplate", "colObj.Def(18) = 0");
	_ObjectSetProperty( column , "Visible", 0);
conditionalformat = _ObjectCallMethod( _ObjectGetProperty( g2antt , "ConditionalFormats") , "Add", 1);
	_ObjectSetProperty( conditionalformat , "Bold", -1);
	_ObjectSetProperty( conditionalformat , "ApplyTo", 1);
chart = _ObjectGetProperty( g2antt , "Chart");
	_ObjectSetProperty( chart , "FirstVisibleDate", "12/30/2000");
	_ObjectSetProperty( chart , "LevelCount", 2);
	_ObjectCallMethod(g2antt, "TemplatePut", "Dim chaObj")
	_ObjectCallMethod(g2antt, "TemplatePut", chart)
	_ObjectCallMethod(g2antt, "ExecuteTemplate", "chaObj.PaneWidth(False) = 48");
	_ObjectSetProperty( chart , "ColumnsFormatLevel", "1");
items = _ObjectGetProperty( g2antt , "Items");
	_ObjectSetProperty( items , "AllowCellValueToItemBar", -1);
	_ObjectCallMethod( items , "AddBar", _ObjectCallMethod( items , "AddItem", "Task 1"),"Task","1/3/2001","1/7/2001");
	_ObjectCallMethod( items , "AddBar", _ObjectCallMethod( items , "AddItem", "Task 2"),"Split","1/3/2001","1/7/2001");
	_ObjectCallMethod( items , "AddBar", _ObjectCallMethod( items , "AddItem", "Task 3"),"Progress","1/3/2001","1/7/2001");
_ObjectCallMethod( g2antt , "EndUpdate");
|
|
1474
|
How can I change the font to display the columns in the chart (Method 1)
OBJECT chart,column,g2antt,items,stdfont;

g2antt =  ObjectByName("AN1") ;
_ObjectCallMethod( g2antt , "BeginUpdate");
_ObjectSetProperty( g2antt , "DefaultItemHeight", 24);
_ObjectCallMethod( _ObjectGetProperty( g2antt , "Columns") , "Add", "Tasks");
column = _ObjectCallMethod( _ObjectGetProperty( g2antt , "Columns") , "Add", "Key");
	_ObjectCallMethod(g2antt, "TemplatePut", "Dim colObj")
	_ObjectCallMethod(g2antt, "TemplatePut", column)
	_ObjectCallMethod(g2antt, "ExecuteTemplate", "colObj.Def(18) = 0");
	_ObjectSetProperty( column , "Visible", 0);
chart = _ObjectGetProperty( g2antt , "Chart");
	_ObjectSetProperty( chart , "FirstVisibleDate", "12/30/2000");
	_ObjectSetProperty( chart , "LevelCount", 2);
	_ObjectCallMethod(g2antt, "TemplatePut", "Dim chaObj")
	_ObjectCallMethod(g2antt, "TemplatePut", chart)
	_ObjectCallMethod(g2antt, "ExecuteTemplate", "chaObj.PaneWidth(False) = 48");
	_ObjectSetProperty( chart , "ColumnsFormatLevel", "1");
	_ObjectSetProperty( chart , "ColumnsFont", _ObjectGetProperty( g2antt , "Font"));
	stdfont = _ObjectGetProperty( chart , "ColumnsFont");
		_ObjectSetProperty( stdfont , "Size", 12);
		_ObjectSetProperty( stdfont , "Name", "Tahoma");
items = _ObjectGetProperty( g2antt , "Items");
	_ObjectSetProperty( items , "AllowCellValueToItemBar", -1);
	_ObjectCallMethod( items , "AddBar", _ObjectCallMethod( items , "AddItem", "Task 1"),"Task","1/3/2001","1/7/2001");
	_ObjectCallMethod( items , "AddBar", _ObjectCallMethod( items , "AddItem", "Task 2"),"Split","1/3/2001","1/7/2001");
	_ObjectCallMethod( items , "AddBar", _ObjectCallMethod( items , "AddItem", "Task 3"),"Progress","1/3/2001","1/7/2001");
_ObjectCallMethod( g2antt , "EndUpdate");
|
|
1473
|
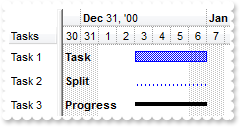
How can I change the column's background color when it is displayed on the chart (Method 2)
OBJECT chart,column,g2antt,items;

g2antt =  ObjectByName("AN1") ;
_ObjectCallMethod( g2antt , "BeginUpdate");
_ObjectCallMethod( _ObjectGetProperty( g2antt , "Columns") , "Add", "Tasks");
column = _ObjectCallMethod( _ObjectGetProperty( g2antt , "Columns") , "Add", "Key");
	_ObjectCallMethod(g2antt, "TemplatePut", "Dim colObj")
	_ObjectCallMethod(g2antt, "TemplatePut", column)
	_ObjectCallMethod(g2antt, "ExecuteTemplate", "colObj.Def(18) = 0");
	_ObjectSetProperty( column , "Visible", 0);
chart = _ObjectGetProperty( g2antt , "Chart");
	_ObjectSetProperty( chart , "FirstVisibleDate", "12/30/2000");
	_ObjectSetProperty( chart , "LevelCount", 2);
	_ObjectCallMethod(g2antt, "TemplatePut", "Dim chaObj")
	_ObjectCallMethod(g2antt, "TemplatePut", chart)
	_ObjectCallMethod(g2antt, "ExecuteTemplate", "chaObj.PaneWidth(False) = 48");
	_ObjectSetProperty( chart , "ColumnsFormatLevel", "1[bg=255]:52");
items = _ObjectGetProperty( g2antt , "Items");
	_ObjectSetProperty( items , "AllowCellValueToItemBar", -1);
	_ObjectCallMethod( items , "AddBar", _ObjectCallMethod( items , "AddItem", "Task 1"),"Task","1/3/2001","1/7/2001");
	_ObjectCallMethod( items , "AddBar", _ObjectCallMethod( items , "AddItem", "Task 2"),"Split","1/3/2001","1/7/2001");
	_ObjectCallMethod( items , "AddBar", _ObjectCallMethod( items , "AddItem", "Task 3"),"Progress","1/3/2001","1/7/2001");
_ObjectCallMethod( g2antt , "EndUpdate");
|
|
1472
|
How can I change the column's background color when it is displayed on the chart (Method 1)
OBJECT chart,column,g2antt,items;

g2antt =  ObjectByName("AN1") ;
_ObjectCallMethod( g2antt , "BeginUpdate");
_ObjectCallMethod( _ObjectGetProperty( g2antt , "Columns") , "Add", "Tasks");
column = _ObjectCallMethod( _ObjectGetProperty( g2antt , "Columns") , "Add", "Key");
	_ObjectCallMethod(g2antt, "TemplatePut", "Dim colObj")
	_ObjectCallMethod(g2antt, "TemplatePut", column)
	_ObjectCallMethod(g2antt, "ExecuteTemplate", "colObj.Def(18) = 0");
	_ObjectSetProperty( column , "Visible", 0);
	_ObjectCallMethod(g2antt, "ExecuteTemplate", "colObj.Def(4) = 15790320");
chart = _ObjectGetProperty( g2antt , "Chart");
	_ObjectSetProperty( chart , "FirstVisibleDate", "12/30/2000");
	_ObjectSetProperty( chart , "LevelCount", 2);
	_ObjectCallMethod(g2antt, "TemplatePut", "Dim chaObj")
	_ObjectCallMethod(g2antt, "TemplatePut", chart)
	_ObjectCallMethod(g2antt, "ExecuteTemplate", "chaObj.PaneWidth(False) = 48");
	_ObjectSetProperty( chart , "ColumnsFormatLevel", "1:52");
items = _ObjectGetProperty( g2antt , "Items");
	_ObjectSetProperty( items , "AllowCellValueToItemBar", -1);
	_ObjectCallMethod( items , "AddBar", _ObjectCallMethod( items , "AddItem", "Task 1"),"Task","1/3/2001","1/7/2001");
	_ObjectCallMethod( items , "AddBar", _ObjectCallMethod( items , "AddItem", "Task 2"),"Split","1/3/2001","1/7/2001");
	_ObjectCallMethod( items , "AddBar", _ObjectCallMethod( items , "AddItem", "Task 3"),"Progress","1/3/2001","1/7/2001");
_ObjectCallMethod( g2antt , "EndUpdate");
|
|
1471
|
Can the chart display any column
OBJECT chart,column,g2antt,items;
g2antt = ObjectByName("AN1") ;
_ObjectCallMethod( g2antt , "BeginUpdate");
_ObjectCallMethod( _ObjectGetProperty( g2antt , "Columns") , "Add", "Tasks");
column = _ObjectCallMethod( _ObjectGetProperty( g2antt , "Columns") , "Add", "Start");
_ObjectCallMethod(g2antt, "TemplatePut", "Dim colObj")
_ObjectCallMethod(g2antt, "TemplatePut", column)
_ObjectCallMethod(g2antt, "ExecuteTemplate", "colObj.Def(18) = 1");
_ObjectSetProperty( column , "Visible", 0);
_ObjectSetProperty( column , "Alignment", 0);
column = _ObjectCallMethod( _ObjectGetProperty( g2antt , "Columns") , "Add", "End");
_ObjectCallMethod(g2antt, "ExecuteTemplate", "colObj.Def(18) = 2");
_ObjectSetProperty( column , "Visible", 0);
_ObjectSetProperty( column , "Alignment", 2);
chart = _ObjectGetProperty( g2antt , "Chart");
_ObjectSetProperty( chart , "FirstVisibleDate", "1/1/2001");
_ObjectSetProperty( chart , "LevelCount", 2);
_ObjectCallMethod(g2antt, "TemplatePut", "Dim chaObj")
_ObjectCallMethod(g2antt, "TemplatePut", chart)
_ObjectCallMethod(g2antt, "ExecuteTemplate", "chaObj.PaneWidth(False) = 48");
_ObjectSetProperty( chart , "ColumnsFormatLevel", "1:52,|,2:52");
items = _ObjectGetProperty( g2antt , "Items");
_ObjectSetProperty( items , "AllowCellValueToItemBar", -1);
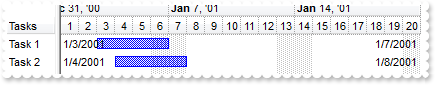
_ObjectCallMethod( items , "AddBar", _ObjectCallMethod( items , "AddItem", "Task 1"),"Task","1/3/2001","1/7/2001");
_ObjectCallMethod( items , "AddBar", _ObjectCallMethod( items , "AddItem", "Task 2"),"Task","1/4/2001","1/8/2001");
_ObjectCallMethod( g2antt , "EndUpdate");
|
|
1470
|
Is it possible to display a check-box column on the chart
OBJECT chart,column,g2antt,items;
g2antt = ObjectByName("AN1") ;
_ObjectCallMethod( _ObjectGetProperty( g2antt , "Columns") , "Add", "Tasks");
column = _ObjectCallMethod( _ObjectGetProperty( g2antt , "Columns") , "Add", "Check");
_ObjectCallMethod(g2antt, "TemplatePut", "Dim colObj")
_ObjectCallMethod(g2antt, "TemplatePut", column)
_ObjectCallMethod(g2antt, "ExecuteTemplate", "colObj.Def(0) = True");
_ObjectSetProperty( column , "Visible", 0);
chart = _ObjectGetProperty( g2antt , "Chart");
_ObjectSetProperty( chart , "FirstVisibleDate", "1/1/2001");
_ObjectSetProperty( chart , "LevelCount", 2);
_ObjectCallMethod(g2antt, "TemplatePut", "Dim chaObj")
_ObjectCallMethod(g2antt, "TemplatePut", chart)
_ObjectCallMethod(g2antt, "ExecuteTemplate", "chaObj.PaneWidth(False) = 48");
_ObjectSetProperty( chart , "ColumnsFormatLevel", "1");
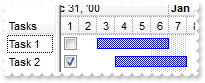
items = _ObjectGetProperty( g2antt , "Items");
_ObjectCallMethod( items , "AddBar", _ObjectCallMethod( items , "AddItem", "Task 1"),"Task","1/3/2001","1/7/2001");
_ObjectCallMethod( items , "AddBar", _ObjectCallMethod( items , "AddItem", "Task 2"),"Task","1/4/2001","1/8/2001");
|
|
1469
|
Is it possible to disable the cell's editor context menu
OBJECT editor,g2antt,items;

g2antt =  ObjectByName("AN1") ;
editor = _ObjectGetProperty( _ObjectCallMethod( _ObjectGetProperty( g2antt , "Columns") , "Add", "Edit") , "Editor");
	_ObjectSetProperty( editor , "EditType", 1);
	_ObjectCallMethod(g2antt, "TemplatePut", "Dim ediObj")
	_ObjectCallMethod(g2antt, "TemplatePut", editor)
	_ObjectCallMethod(g2antt, "ExecuteTemplate", "ediObj.Option(202) = False");
items = _ObjectGetProperty( g2antt , "Items");
	_ObjectCallMethod( items , "AddItem", 10);
	_ObjectCallMethod( items , "AddItem", 20);
|
|
1468
|
How can I find a value in a drop down editor
OBJECT editor,g2antt,items;

g2antt =  ObjectByName("AN1") ;
editor = _ObjectGetProperty( _ObjectCallMethod( _ObjectGetProperty( g2antt , "Columns") , "Add", "DropDownList") , "Editor");
	_ObjectSetProperty( editor , "EditType", 3);
	_ObjectCallMethod( editor , "AddItem", 1,"DDList 1");
	_ObjectCallMethod( editor , "AddItem", 2,"DDList 2");
	_ObjectCallMethod( editor , "AddItem", 3,"DDList 3");
editor = _ObjectGetProperty( _ObjectCallMethod( _ObjectGetProperty( g2antt , "Columns") , "Add", "DropDown") , "Editor");
	_ObjectSetProperty( editor , "EditType", 2);
	_ObjectCallMethod( editor , "AddItem", 1,"DDType 1");
	_ObjectCallMethod( editor , "AddItem", 2,"DDType 2");
	_ObjectCallMethod( editor , "AddItem", 3,"DDType 3");
items = _ObjectGetProperty( g2antt , "Items");
	_ObjectCallMethod(g2antt, "TemplatePut", "Dim iteObj")
	_ObjectCallMethod(g2antt, "TemplatePut", items)
	_ObjectCallMethod(g2antt, "ExecuteTemplate", "iteObj.CellValue(AddItem(1),1) = Me.Columns.Item(1).Editor.FindItem(1)");
	_ObjectCallMethod(g2antt, "ExecuteTemplate", "iteObj.CellValue(AddItem(2),1) = Me.Columns.Item(1).Editor.FindItem(2)");
|
|
1467
|
What is the difference between DropDownType and DropDownListType
OBJECT editor,g2antt,items;

g2antt =  ObjectByName("AN1") ;
editor = _ObjectGetProperty( _ObjectCallMethod( _ObjectGetProperty( g2antt , "Columns") , "Add", "DropDownList") , "Editor");
	_ObjectSetProperty( editor , "EditType", 3);
	_ObjectCallMethod( editor , "AddItem", 1,"First item");
	_ObjectCallMethod( editor , "AddItem", 2,"Second item");
	_ObjectCallMethod( editor , "AddItem", 3,"Third item");
editor = _ObjectGetProperty( _ObjectCallMethod( _ObjectGetProperty( g2antt , "Columns") , "Add", "DropDown") , "Editor");
	_ObjectSetProperty( editor , "EditType", 2);
	_ObjectCallMethod( editor , "AddItem", 1,"First item");
	_ObjectCallMethod( editor , "AddItem", 2,"Second item");
	_ObjectCallMethod( editor , "AddItem", 3,"Third item");
items = _ObjectGetProperty( g2antt , "Items");
	_ObjectCallMethod(g2antt, "TemplatePut", "Dim iteObj")
	_ObjectCallMethod(g2antt, "TemplatePut", items)
	_ObjectCallMethod(g2antt, "ExecuteTemplate", "iteObj.CellValue(AddItem(1),1) = `Any`");
	_ObjectCallMethod(g2antt, "ExecuteTemplate", "iteObj.CellValue(AddItem(2),1) = `Any`");
|
|
1466
|
How can I mark or enlarge the selected bars, so I have a clear frame around (Method 3)
OBJECT appearance,chart,g2antt,items;

g2antt =  ObjectByName("AN1") ;
_ObjectCallMethod( g2antt , "BeginUpdate");
_ObjectSetProperty( g2antt , "DefaultItemHeight", 32);
appearance = _ObjectGetProperty( g2antt , "VisualAppearance");
	_ObjectCallMethod( appearance , "Add", 1,"c:\exontrol\images\normal.ebn");
	_ObjectCallMethod( appearance , "Add", 2,"CP:1 -2 -2 2 2");
chart = _ObjectGetProperty( g2antt , "Chart");
	_ObjectCallMethod(g2antt, "TemplatePut", "Dim chaObj")
	_ObjectCallMethod(g2antt, "TemplatePut", chart)
	_ObjectCallMethod(g2antt, "ExecuteTemplate", "chaObj.PaneWidth(0) = 48");
	_ObjectSetProperty( chart , "FirstVisibleDate", "1/1/2002");
	_ObjectSetProperty( chart , "SelBarColor", 50266112);
	_ObjectCallMethod(g2antt, "ExecuteTemplate", "chaObj.Bars.Item(`Task`).Color = 16777216");
_ObjectCallMethod( _ObjectGetProperty( g2antt , "Columns") , "Add", "Task");
items = _ObjectGetProperty( g2antt , "Items");
	h = _ObjectCallMethod( items , "AddItem", "Task 1");
	_ObjectCallMethod( items , "AddBar", h,"Task","1/2/2002","1/4/2002","A");
	_ObjectCallMethod( items , "AddBar", h,"Task","1/6/2002","1/10/2002","B");
	_ObjectCallMethod( items , "AddBar", h,"Task","1/11/2002","1/14/2002","C");
	_ObjectCallMethod(g2antt, "TemplatePut", "Dim iteObj,h")
	_ObjectCallMethod(g2antt, "TemplatePut", items)
	_ObjectCallMethod(g2antt, "TemplatePut", h)
	_ObjectCallMethod(g2antt, "ExecuteTemplate", "iteObj.ItemBar(h,`A`,257) = True");
	_ObjectCallMethod(g2antt, "ExecuteTemplate", "iteObj.ItemBar(h,`B`,257) = True");
_ObjectCallMethod( g2antt , "EndUpdate");
|
|
1465
|
How can I mark or enlarge the selected bars, so I have a clear frame around (Method 2)
OBJECT appearance,chart,g2antt,items;

g2antt =  ObjectByName("AN1") ;
_ObjectCallMethod( g2antt , "BeginUpdate");
_ObjectSetProperty( g2antt , "DefaultItemHeight", 32);
appearance = _ObjectGetProperty( g2antt , "VisualAppearance");
	_ObjectCallMethod( appearance , "Add", 1,"c:\exontrol\images\normal.ebn");
	_ObjectCallMethod( appearance , "Add", 2,"CP:1 -2 -2 2 2");
chart = _ObjectGetProperty( g2antt , "Chart");
	_ObjectCallMethod(g2antt, "TemplatePut", "Dim chaObj")
	_ObjectCallMethod(g2antt, "TemplatePut", chart)
	_ObjectCallMethod(g2antt, "ExecuteTemplate", "chaObj.PaneWidth(0) = 48");
	_ObjectSetProperty( chart , "FirstVisibleDate", "1/1/2002");
	_ObjectSetProperty( chart , "SelBarColor", 33554432);
	_ObjectCallMethod(g2antt, "ExecuteTemplate", "chaObj.Bars.Item(`Task`).Color = 16777216");
_ObjectCallMethod( _ObjectGetProperty( g2antt , "Columns") , "Add", "Task");
items = _ObjectGetProperty( g2antt , "Items");
	h = _ObjectCallMethod( items , "AddItem", "Task 1");
	_ObjectCallMethod( items , "AddBar", h,"Task","1/2/2002","1/4/2002","A");
	_ObjectCallMethod( items , "AddBar", h,"Task","1/6/2002","1/10/2002","B");
	_ObjectCallMethod( items , "AddBar", h,"Task","1/11/2002","1/14/2002","C");
	_ObjectCallMethod(g2antt, "TemplatePut", "Dim iteObj,h")
	_ObjectCallMethod(g2antt, "TemplatePut", items)
	_ObjectCallMethod(g2antt, "TemplatePut", h)
	_ObjectCallMethod(g2antt, "ExecuteTemplate", "iteObj.ItemBar(h,`A`,257) = True");
	_ObjectCallMethod(g2antt, "ExecuteTemplate", "iteObj.ItemBar(h,`B`,257) = True");
_ObjectCallMethod( g2antt , "EndUpdate");
|
|
1464
|
How can I mark or enlarge the selected bars, so I have a clear frame around (Method 1)
OBJECT appearance,chart,g2antt,items;

g2antt =  ObjectByName("AN1") ;
_ObjectCallMethod( g2antt , "BeginUpdate");
_ObjectSetProperty( g2antt , "DefaultItemHeight", 32);
appearance = _ObjectGetProperty( g2antt , "VisualAppearance");
	_ObjectCallMethod( appearance , "Add", 1,"gBFLBCJwBAEHhEJAEGg4BNkMQAAYAQGKIYBkAKBQAGaAoDDYNQwQwAAwjIKEEwsACEIrjKCVIgkHYJRjGEZxMAsEwjAoaQChEZRUhEMgxDDIIxAJIcaw0GSEZwgOQZB" +
	"iOEYnDANMgzDLMZR7DajYymSA6LiKNo+QjKFB0NLMVRtEIIIzCSCaNomT4DS4NIi2DYcVhhMqBYbtCZZBo2FpZUxXdL0BJMVxbHKYJikW4pVjoAJ+TxccjVDQNJyLQ6r" +
	"YzuAAKNpuO58RbdGDQHA9KyfLCEcTxYAMbp6X5kaBZVp2VCMRzbTLUIDzPNVCTrNIaJioAaMeiCG5NUzieqRNalLABFjZMIHDbtGynDIJZruW52+CLIZpWbEOiRXr2Tx" +
	"xgGYp5Fie5mAYBgIgSFDrDOIZUmQZYiECXJUjIEQ3lUGgbEIRQcg+Hg8DEFxYFuOR/i+X5znufh/omBgCgCVwjn4BoBmCCAmAqApgkefgMgOYQID4DoELsUgTgUYYIC4" +
	"F4GGGSAaBuBxhhgfgggUYgog4EYJGIaBJn6ChiBiLgsgkIpoj4J4BCMSJWDaDZjgiZgCEAQCAgA==");
	_ObjectCallMethod( appearance , "Add", 2,"CP:1 -2 -2 2 2");
chart = _ObjectGetProperty( g2antt , "Chart");
	_ObjectSetProperty( chart , "FirstVisibleDate", "1/1/2002");
	_ObjectSetProperty( chart , "SelBarColor", 33554432);
	_ObjectCallMethod(g2antt, "TemplatePut", "Dim chaObj")
	_ObjectCallMethod(g2antt, "TemplatePut", chart)
	_ObjectCallMethod(g2antt, "ExecuteTemplate", "chaObj.PaneWidth(0) = 48");
_ObjectCallMethod( _ObjectGetProperty( g2antt , "Columns") , "Add", "Task");
items = _ObjectGetProperty( g2antt , "Items");
	h = _ObjectCallMethod( items , "AddItem", "Task 1");
	_ObjectCallMethod( items , "AddBar", h,"Task","1/2/2002","1/4/2002","A");
	_ObjectCallMethod( items , "AddBar", h,"Task","1/6/2002","1/10/2002","B");
	_ObjectCallMethod( items , "AddBar", h,"Task","1/11/2002","1/14/2002","C");
	_ObjectCallMethod(g2antt, "TemplatePut", "Dim iteObj,h")
	_ObjectCallMethod(g2antt, "TemplatePut", items)
	_ObjectCallMethod(g2antt, "TemplatePut", h)
	_ObjectCallMethod(g2antt, "ExecuteTemplate", "iteObj.ItemBar(h,`A`,257) = True");
	_ObjectCallMethod(g2antt, "ExecuteTemplate", "iteObj.ItemBar(h,`B`,257) = True");
_ObjectCallMethod( g2antt , "EndUpdate");
|
|
1463
|
How can I load my table from an Access 2007, using ADO
// AddItem event - Occurs after a new Item has been inserted to Items collection.
FUNCTION g2anttEvents_AddItem(OBJECT g2antt, INT Item)
	OBJECT items;
	items = _ObjectGetProperty( g2antt , "Items");
		_ObjectCallMethod(g2antt, "TemplatePut", "Dim iteObj,Item")
		_ObjectCallMethod(g2antt, "TemplatePut", items)
		_ObjectCallMethod(g2antt, "TemplatePut", Item)
		_ObjectCallMethod( items , "AddBar", Item,"Task",_ObjectCallMethod(g2antt, "ExecuteTemplate", "iteObj.CellValue(Item,2)"),_ObjectCallMethod(g2antt, "ExecuteTemplate", "iteObj.CellValue(Item,4)"));
END

OBJECT chart,g2antt,rs;

g2antt =  ObjectByName("AN1") ;
ObjectAssociateEvents("g2anttEvents", g2antt);
_ObjectCallMethod( g2antt , "BeginUpdate");
chart = _ObjectGetProperty( g2antt , "Chart");
	_ObjectSetProperty( chart , "FirstVisibleDate", "8/3/1994");
	_ObjectCallMethod(g2antt, "TemplatePut", "Dim chaObj")
	_ObjectCallMethod(g2antt, "TemplatePut", chart)
	_ObjectCallMethod(g2antt, "ExecuteTemplate", "chaObj.PaneWidth(False) = 256");
	_ObjectSetProperty( chart , "LevelCount", 2);
	_ObjectSetProperty( chart , "UnitScale", 4096);
	_ObjectSetProperty( chart , "FirstWeekDay", 1);
	_ObjectSetProperty( chart , "OverviewVisible", 2);
_ObjectSetProperty( g2antt , "ColumnAutoResize", 0);
_ObjectSetProperty( g2antt , "ContinueColumnScroll", 0);
rs = CreateObject("ADOR.Recordset");
	_ObjectCallMethod( rs , "Open", "Orders","Provider=Microsoft.ACE.OLEDB.12.0;Data Source=C:\Program Files\Exontrol\ExG2antt\Sample\Access\misc.accdb",3,3);
_ObjectSetProperty( g2antt , "DataSource", rs);
_ObjectSetProperty( _ObjectGetProperty( g2antt , "Items") , "AllowCellValueToItemBar", -1);
_ObjectCallMethod(g2antt, "ExecuteTemplate", "Columns.Item(2).Def(18) = 1");
_ObjectCallMethod(g2antt, "ExecuteTemplate", "Columns.Item(4).Def(18) = 2");
_ObjectCallMethod( g2antt , "EndUpdate");
|
|
1462
|
Is it possible to enumerate the links without enumerating them
OBJECT chart,g2antt,items;

g2antt =  ObjectByName("AN1") ;
_ObjectSetProperty( g2antt , "AntiAliasing", -1);
_ObjectCallMethod( _ObjectGetProperty( g2antt , "Columns") , "Add", "Task");
chart = _ObjectGetProperty( g2antt , "Chart");
	_ObjectSetProperty( chart , "FirstVisibleDate", "1/1/2001");
	_ObjectCallMethod(g2antt, "TemplatePut", "Dim chaObj")
	_ObjectCallMethod(g2antt, "TemplatePut", chart)
	_ObjectCallMethod(g2antt, "ExecuteTemplate", "chaObj.PaneWidth(False) = 128");
	_ObjectSetProperty( chart , "NonworkingDays", 0);
	_ObjectSetProperty( chart , "LinksWidth", 2);
items = _ObjectGetProperty( g2antt , "Items");
	h1 = _ObjectCallMethod( items , "AddItem", "Task 1");
	_ObjectCallMethod( items , "AddBar", h1,"Task","1/2/2001","1/4/2001","K1");
	h2 = _ObjectCallMethod( items , "AddItem", "Task 2");
	_ObjectCallMethod( items , "AddBar", h2,"Task","1/6/2001","1/8/2001","K2");
	_ObjectCallMethod( items , "AddLink", "L1",h1,"K1",h2,"K2");
	h3 = _ObjectCallMethod( items , "AddItem", "Task 3");
	_ObjectCallMethod( items , "AddBar", h3,"Task","1/10/2001","1/12/2001","K3");
	_ObjectCallMethod( items , "AddLink", "L2",h2,"K2",h3,"K3");
	h4 = _ObjectCallMethod( items , "AddItem", "Task 4");
	_ObjectCallMethod( items , "AddBar", h4,"Task","1/14/2001","1/16/2001","K4");
	_ObjectCallMethod( items , "AddLink", "L3",h3,"K3",h4,"K4");
	_ObjectCallMethod(g2antt, "TemplatePut", "Dim iteObj")
	_ObjectCallMethod(g2antt, "TemplatePut", items)
	_ObjectCallMethod(g2antt, "ExecuteTemplate", "iteObj.Link(`<L*>`,11) = False");
|
|
1461
|
How can I display a vertical line in the chart
// Click event - Occurs when the user presses and then releases the left mouse button over the tree control.
FUNCTION g2anttEvents_Click()
	OBJECT chart;
	chart = _ObjectGetProperty( g2antt , "Chart");
		_ObjectSetProperty( chart , "MarkNowColor", 255);
		_ObjectCallMethod(g2antt, "TemplatePut", "Dim chaObj")
		_ObjectCallMethod(g2antt, "TemplatePut", chart)
		_ObjectSetProperty( chart , "MarkNow", _ObjectCallMethod(g2antt, "ExecuteTemplate", "chaObj.DateFromPoint(-1,-1)"));
END

OBJECT chart,g2antt;

g2antt =  ObjectByName("AN1") ;
ObjectAssociateEvents("g2anttEvents", g2antt);
chart = _ObjectGetProperty( g2antt , "Chart");
	_ObjectSetProperty( chart , "FirstVisibleDate", "3/13/2012");
	_ObjectCallMethod(g2antt, "ExecuteTemplate", "chaObj.PaneWidth(False) = 0");
	_ObjectSetProperty( chart , "LevelCount", 2);
	_ObjectSetProperty( chart , "MarkNowColor", 0);
	_ObjectSetProperty( chart , "MarkNowWidth", 3);
	_ObjectSetProperty( chart , "UnitWidth", 32);
	_ObjectSetProperty( chart , "ResizeUnitScale", 65536);
|
|
1460
|
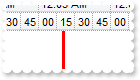
How can I use the MarkNowColor to mark a time line different then the time on the machine
OBJECT chart,g2antt,level;

g2antt =  ObjectByName("AN1") ;
chart = _ObjectGetProperty( g2antt , "Chart");
	_ObjectSetProperty( chart , "FirstVisibleDate", "3/13/2012");
	_ObjectCallMethod(g2antt, "TemplatePut", "Dim chaObj")
	_ObjectCallMethod(g2antt, "TemplatePut", chart)
	_ObjectCallMethod(g2antt, "ExecuteTemplate", "chaObj.PaneWidth(False) = 0");
	_ObjectSetProperty( chart , "LevelCount", 2);
	_ObjectCallMethod(g2antt, "ExecuteTemplate", "chaObj.Level(0).Label = 1048576");
	level = _ObjectCallMethod(g2antt, "ExecuteTemplate", "chaObj.Level(1)");
		_ObjectSetProperty( level , "Label", "<%ss%>");
		_ObjectSetProperty( level , "Count", 15);
	_ObjectSetProperty( chart , "MarkNowColor", 255);
	_ObjectSetProperty( chart , "MarkNowWidth", 3);
	_ObjectSetProperty( chart , "MarkNow", "3/13/2012 12:03:20 AM");
|
|
1459
|
Is it possible to show the current date time using a delay
OBJECT chart,g2antt,items,level;

g2antt =  ObjectByName("AN1") ;
chart = _ObjectGetProperty( g2antt , "Chart");
	_ObjectCallMethod(g2antt, "TemplatePut", "Dim chaObj")
	_ObjectCallMethod(g2antt, "TemplatePut", chart)
	_ObjectCallMethod(g2antt, "ExecuteTemplate", "chaObj.PaneWidth(False) = 0");
	_ObjectSetProperty( chart , "LevelCount", 2);
	_ObjectCallMethod(g2antt, "ExecuteTemplate", "chaObj.Level(0).Label = 1048576");
	level = _ObjectCallMethod(g2antt, "ExecuteTemplate", "chaObj.Level(1)");
		_ObjectSetProperty( level , "Label", "<%ss%>");
		_ObjectSetProperty( level , "Count", 15);
	_ObjectSetProperty( chart , "MarkNowColor", 16711680);
	_ObjectSetProperty( chart , "MarkNowWidth", 3);
	_ObjectSetProperty( chart , "MarkNowDelay", 0.00069444);
_ObjectCallMethod( _ObjectGetProperty( g2antt , "Columns") , "Add", "Tasks");
items = _ObjectGetProperty( g2antt , "Items");
	_ObjectCallMethod( items , "AddBar", _ObjectCallMethod( items , "AddItem", "Item 1"),"Task","1/1/2008","1/1/2018");
|
|
1458
|
What are the options to show the links between bars
OBJECT chart,g2antt,items;

g2antt =  ObjectByName("AN1") ;
_ObjectSetProperty( g2antt , "AntiAliasing", -1);
_ObjectCallMethod( _ObjectGetProperty( g2antt , "Columns") , "Add", "Task");
chart = _ObjectGetProperty( g2antt , "Chart");
	_ObjectSetProperty( chart , "FirstVisibleDate", "1/1/2001");
	_ObjectCallMethod(g2antt, "TemplatePut", "Dim chaObj")
	_ObjectCallMethod(g2antt, "TemplatePut", chart)
	_ObjectCallMethod(g2antt, "ExecuteTemplate", "chaObj.PaneWidth(False) = 128");
	_ObjectSetProperty( chart , "NonworkingDays", 0);
	_ObjectSetProperty( chart , "LinksWidth", 2);
items = _ObjectGetProperty( g2antt , "Items");
	h1 = _ObjectCallMethod( items , "AddItem", "Task 1");
	_ObjectCallMethod( items , "AddItem", "");
	_ObjectCallMethod( items , "AddBar", h1,"Task","1/2/2001","1/4/2001","K1");
	h2 = _ObjectCallMethod( items , "AddItem", "Task 2");
	_ObjectCallMethod( items , "AddItem", "");
	_ObjectCallMethod( items , "AddBar", h2,"Task","1/6/2001","1/8/2001","K2");
	_ObjectCallMethod( items , "AddLink", "L1",h1,"K1",h2,"K2");
	h3 = _ObjectCallMethod( items , "AddItem", "Task 3");
	_ObjectCallMethod( items , "AddItem", "");
	_ObjectCallMethod( items , "AddBar", h3,"Task","1/12/2001","1/14/2001","K3");
	_ObjectCallMethod( items , "AddLink", "L2",h2,"K2",h3,"K3");
	_ObjectCallMethod(g2antt, "TemplatePut", "Dim iteObj")
	_ObjectCallMethod(g2antt, "TemplatePut", items)
	_ObjectCallMethod(g2antt, "ExecuteTemplate", "iteObj.Link(`L2`,15) = -1");
	h4 = _ObjectCallMethod( items , "AddItem", "Task 4");
	_ObjectCallMethod( items , "AddBar", h4,"Task","1/18/2001","1/20/2001","K4");
	_ObjectCallMethod( items , "AddLink", "L3",h3,"K3",h4,"K4");
	_ObjectCallMethod(g2antt, "ExecuteTemplate", "iteObj.Link(`L3`,15) = 1");
	_ObjectCallMethod( items , "AddItem", "");
	h5 = _ObjectCallMethod( items , "AddItem", "Task 5");
	_ObjectCallMethod( items , "AddBar", h5,"Task","1/22/2001","1/24/2001","K5");
	_ObjectCallMethod( items , "AddLink", "L4",h4,"K4",h5,"K5");
	_ObjectCallMethod(g2antt, "ExecuteTemplate", "iteObj.Link(`L4`,15) = 2");
|
|
1457
|
Is it possible to specify the link between bars to be a wider line
OBJECT chart,g2antt,items;

g2antt =  ObjectByName("AN1") ;
_ObjectCallMethod( _ObjectGetProperty( g2antt , "Columns") , "Add", "Task");
chart = _ObjectGetProperty( g2antt , "Chart");
	_ObjectSetProperty( chart , "FirstVisibleDate", "1/1/2001");
	_ObjectCallMethod(g2antt, "TemplatePut", "Dim chaObj")
	_ObjectCallMethod(g2antt, "TemplatePut", chart)
	_ObjectCallMethod(g2antt, "ExecuteTemplate", "chaObj.PaneWidth(False) = 128");
	_ObjectSetProperty( chart , "NonworkingDays", 0);
	_ObjectSetProperty( chart , "LinksStyle", 0);
	_ObjectSetProperty( chart , "LinksWidth", 2);
	_ObjectSetProperty( chart , "LinksColor", 255);
items = _ObjectGetProperty( g2antt , "Items");
	h1 = _ObjectCallMethod( items , "AddItem", "Task 1");
	_ObjectCallMethod( items , "AddBar", h1,"Task","1/2/2001","1/4/2001","K1");
	h2 = _ObjectCallMethod( items , "AddItem", "Task 2");
	_ObjectCallMethod( items , "AddBar", h2,"Task","1/6/2001","1/8/2001","K2");
	_ObjectCallMethod( items , "AddLink", "L1",h1,"K1",h2,"K2");
	h3 = _ObjectCallMethod( items , "AddItem", "Task 3");
	_ObjectCallMethod( items , "AddBar", h3,"Task","1/10/2001","1/12/2001","K3");
	_ObjectCallMethod( items , "AddLink", "L2",h2,"K2",h3,"K3");
|
|
1456
|
Is it possible to create a link between the two specified bars so that the link was a straight line
OBJECT chart,g2antt,items;

g2antt =  ObjectByName("AN1") ;
_ObjectCallMethod( _ObjectGetProperty( g2antt , "Columns") , "Add", "Task");
_ObjectSetProperty( g2antt , "AntiAliasing", -1);
chart = _ObjectGetProperty( g2antt , "Chart");
	_ObjectSetProperty( chart , "FirstVisibleDate", "1/1/2001");
	_ObjectCallMethod(g2antt, "TemplatePut", "Dim chaObj")
	_ObjectCallMethod(g2antt, "TemplatePut", chart)
	_ObjectCallMethod(g2antt, "ExecuteTemplate", "chaObj.PaneWidth(False) = 128");
	_ObjectSetProperty( chart , "NonworkingDays", 0);
items = _ObjectGetProperty( g2antt , "Items");
	h1 = _ObjectCallMethod( items , "AddItem", "Task 1");
	_ObjectCallMethod( items , "AddBar", h1,"Task","1/2/2001","1/4/2001","K1");
	h2 = _ObjectCallMethod( items , "AddItem", "Task 2");
	_ObjectCallMethod( items , "AddBar", h2,"Task","1/6/2001","1/8/2001","K2");
	_ObjectCallMethod( items , "AddLink", "L1",h1,"K1",h2,"K2");
	_ObjectCallMethod(g2antt, "TemplatePut", "Dim iteObj")
	_ObjectCallMethod(g2antt, "TemplatePut", items)
	_ObjectCallMethod(g2antt, "ExecuteTemplate", "iteObj.Link(`L1`,9) = 0");
	_ObjectCallMethod(g2antt, "ExecuteTemplate", "iteObj.Link(`L1`,10) = 2");
	_ObjectCallMethod(g2antt, "ExecuteTemplate", "iteObj.Link(`L1`,8) = 255");
	_ObjectCallMethod(g2antt, "ExecuteTemplate", "iteObj.Link(`L1`,15) = 2");
	h3 = _ObjectCallMethod( items , "AddItem", "Task 3");
	_ObjectCallMethod( items , "AddBar", h3,"Task","1/10/2001","1/12/2001","K3");
	_ObjectCallMethod( items , "AddLink", "L2",h2,"K2",h3,"K3");
|
|
1455
|
I associate the bars with my columns, Start and End, but can not get it working for bars with non-empty keys. What am I doing wrong
OBJECT chart,column,columns,g2antt,items;

g2antt =  ObjectByName("AN1") ;
_ObjectCallMethod( g2antt , "BeginUpdate");
columns = _ObjectGetProperty( g2antt , "Columns");
	_ObjectCallMethod( columns , "Add", "Tasks");
	column = _ObjectCallMethod( columns , "Add", "Start");
		_ObjectCallMethod(g2antt, "TemplatePut", "Dim colObj")
		_ObjectCallMethod(g2antt, "TemplatePut", column)
		_ObjectCallMethod(g2antt, "ExecuteTemplate", "colObj.Def(18) = 1");
		_ObjectCallMethod(g2antt, "ExecuteTemplate", "colObj.Def(19) = `A`");
	column = _ObjectCallMethod( columns , "Add", "End");
		_ObjectCallMethod(g2antt, "ExecuteTemplate", "colObj.Def(18) = 2");
		_ObjectCallMethod(g2antt, "ExecuteTemplate", "colObj.Def(19) = `A`");
_ObjectSetProperty( _ObjectGetProperty( g2antt , "Items") , "AllowCellValueToItemBar", -1);
chart = _ObjectGetProperty( g2antt , "Chart");
	_ObjectCallMethod(g2antt, "TemplatePut", "Dim chaObj")
	_ObjectCallMethod(g2antt, "TemplatePut", chart)
	_ObjectCallMethod(g2antt, "ExecuteTemplate", "chaObj.PaneWidth(False) = 256");
	_ObjectSetProperty( chart , "FirstVisibleDate", "1/1/2002");
	_ObjectSetProperty( chart , "LevelCount", 2);
	_ObjectCallMethod(g2antt, "ExecuteTemplate", "chaObj.Bars.Item(`Task`).OverlaidType = 3");
items = _ObjectGetProperty( g2antt , "Items");
	_ObjectCallMethod( items , "AddBar", _ObjectCallMethod( items , "AddItem", "Task 1"),"Task","1/4/2002","1/8/2002","A","A");
	h = _ObjectCallMethod( items , "AddItem", "Task 2");
	_ObjectCallMethod( items , "AddBar", h,"Task","1/6/2002","1/10/2002","A","A");
	_ObjectCallMethod( items , "AddBar", h,"Task","1/4/2002","1/8/2002","B","B");
	_ObjectCallMethod(g2antt, "TemplatePut", "Dim iteObj,h")
	_ObjectCallMethod(g2antt, "TemplatePut", items)
	_ObjectCallMethod(g2antt, "TemplatePut", h)
	_ObjectCallMethod(g2antt, "ExecuteTemplate", "iteObj.ItemBar(h,`B`,33) = 255");
_ObjectCallMethod( g2antt , "EndUpdate");
|
|
1454
|
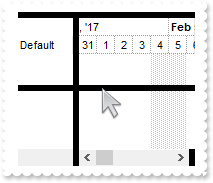
The right pane needs to show ONLY the hours 6am to 9pm (every hour) for one day only and the user should not to be able to scroll left or right nor see any other hours. How can I do that
OBJECT chart,g2antt;

g2antt =  ObjectByName("AN1") ;
_ObjectCallMethod( g2antt , "BeginUpdate");
_ObjectCallMethod( _ObjectGetProperty( g2antt , "Columns") , "Add", "Tasks");
chart = _ObjectGetProperty( g2antt , "Chart");
	_ObjectSetProperty( chart , "LevelCount", 2);
	_ObjectCallMethod(g2antt, "TemplatePut", "Dim chaObj")
	_ObjectCallMethod(g2antt, "TemplatePut", chart)
	_ObjectCallMethod(g2antt, "ExecuteTemplate", "chaObj.ScrollRange(0) = #1/1/2001#");
	_ObjectCallMethod(g2antt, "ExecuteTemplate", "chaObj.ScrollRange(1) = #1/1/2001#");
	_ObjectSetProperty( chart , "UnitScale", 65536);
	_ObjectSetProperty( chart , "NonworkingHours", 12582975);
	_ObjectSetProperty( chart , "ShowNonworkingUnits", 0);
	_ObjectSetProperty( chart , "ShowNonworkingHours", 0);
	_ObjectCallMethod(g2antt, "ExecuteTemplate", "chaObj.Level(0).Alignment = 17");
	_ObjectSetProperty( chart , "UnitWidth", 18);
	_ObjectCallMethod(g2antt, "ExecuteTemplate", "chaObj.PaneWidth(True) = 294");
	_ObjectSetProperty( chart , "ScrollBar", 0);
_ObjectSetProperty( g2antt , "OnResizeControl", 128);
_ObjectCallMethod( g2antt , "EndUpdate");
|
|
1453
|
Is it possible to count only a specified type of bars without enumerating them
OBJECT g2antt,items;

g2antt =  ObjectByName("AN1") ;
_ObjectCallMethod( _ObjectGetProperty( g2antt , "Columns") , "Add", "Tasks");
_ObjectSetProperty( _ObjectGetProperty( g2antt , "Chart") , "FirstVisibleDate", "1/1/2001");
items = _ObjectGetProperty( g2antt , "Items");
	_ObjectCallMethod( items , "AddBar", _ObjectCallMethod( items , "AddItem", "Task 1"),"Task","1/2/2001","1/4/2001","K1","K1");
	_ObjectCallMethod( items , "AddBar", _ObjectCallMethod( items , "AddItem", "Task 2"),"Progress","1/3/2001","1/5/2001");
	_ObjectCallMethod( items , "AddBar", _ObjectCallMethod( items , "AddItem", "Task 3"),"Task","1/2/2001","1/4/2001","P3","P3");
	_ObjectCallMethod(g2antt, "TemplatePut", "Dim iteObj")
	_ObjectCallMethod(g2antt, "TemplatePut", items)
	Message( "K*" );
	Message( _ObjectCallMethod(g2antt, "ExecuteTemplate", "iteObj.ItemBar(0,`<K*>`,256)") );
	Message( "K* P*" );
	Message( _ObjectCallMethod(g2antt, "ExecuteTemplate", "iteObj.ItemBar(0,`<K* P*>`,256)") );
|
|
1452
|
How can I count or get the numbers of the bars in the chart
OBJECT g2antt,items;

g2antt =  ObjectByName("AN1") ;
_ObjectCallMethod( _ObjectGetProperty( g2antt , "Columns") , "Add", "Tasks");
_ObjectSetProperty( _ObjectGetProperty( g2antt , "Chart") , "FirstVisibleDate", "1/1/2001");
items = _ObjectGetProperty( g2antt , "Items");
	_ObjectCallMethod( items , "AddBar", _ObjectCallMethod( items , "AddItem", "Task 1"),"Task","1/2/2001","1/4/2001","K1","K1");
	_ObjectCallMethod( items , "AddBar", _ObjectCallMethod( items , "AddItem", "Task 2"),"Task","1/2/2001","1/4/2001","A2","A2");
	_ObjectCallMethod( items , "AddBar", _ObjectCallMethod( items , "AddItem", "Task 3"),"Task","1/2/2001","1/4/2001","K3","K3");
	_ObjectCallMethod(g2antt, "TemplatePut", "Dim iteObj")
	_ObjectCallMethod(g2antt, "TemplatePut", items)
	Message( "All" );
	Message( _ObjectCallMethod(g2antt, "ExecuteTemplate", "iteObj.ItemBar(0,`<*>`,256)") );
	Message( "A*" );
	Message( _ObjectCallMethod(g2antt, "ExecuteTemplate", "iteObj.ItemBar(0,`<A*>`,256)") );
	Message( "K*" );
	Message( _ObjectCallMethod(g2antt, "ExecuteTemplate", "iteObj.ItemBar(0,`<K*>`,256)") );
|
|
1451
|
Is it possible to remove only specified bars from ALL items at once
OBJECT g2antt,items;

g2antt =  ObjectByName("AN1") ;
_ObjectCallMethod( _ObjectGetProperty( g2antt , "Columns") , "Add", "Tasks");
_ObjectSetProperty( _ObjectGetProperty( g2antt , "Chart") , "FirstVisibleDate", "1/1/2001");
items = _ObjectGetProperty( g2antt , "Items");
	_ObjectCallMethod( items , "AddBar", _ObjectCallMethod( items , "AddItem", "Task 1"),"Task","1/2/2001","1/4/2001","K1","K1");
	_ObjectCallMethod( items , "AddBar", _ObjectCallMethod( items , "AddItem", "Task 2"),"Task","1/2/2001","1/4/2001","A2","A2");
	_ObjectCallMethod( items , "AddBar", _ObjectCallMethod( items , "AddItem", "Task 3"),"Task","1/2/2001","1/4/2001","K3","K3");
	_ObjectCallMethod( items , "RemoveBar", 0,"<K*>");
|
|
1450
|
How can I remove all bars from the chart (method 2)
OBJECT g2antt,items;

g2antt =  ObjectByName("AN1") ;
_ObjectCallMethod( _ObjectGetProperty( g2antt , "Columns") , "Add", "Tasks");
_ObjectSetProperty( _ObjectGetProperty( g2antt , "Chart") , "FirstVisibleDate", "1/1/2001");
items = _ObjectGetProperty( g2antt , "Items");
	_ObjectCallMethod( items , "AddBar", _ObjectCallMethod( items , "AddItem", "Task 1"),"Task","1/2/2001","1/4/2001","K1","K1");
	_ObjectCallMethod( items , "AddBar", _ObjectCallMethod( items , "AddItem", "Task 2"),"Task","1/2/2001","1/4/2001","A2","A2");
	_ObjectCallMethod( items , "AddBar", _ObjectCallMethod( items , "AddItem", "Task 3"),"Task","1/2/2001","1/4/2001","K3","K3");
	_ObjectCallMethod( items , "ClearBars", 0);
|
|
1449
|
How can I remove all bars from the chart (method 1)
OBJECT g2antt,items;

g2antt =  ObjectByName("AN1") ;
_ObjectCallMethod( _ObjectGetProperty( g2antt , "Columns") , "Add", "Tasks");
_ObjectSetProperty( _ObjectGetProperty( g2antt , "Chart") , "FirstVisibleDate", "1/1/2001");
items = _ObjectGetProperty( g2antt , "Items");
	_ObjectCallMethod( items , "AddBar", _ObjectCallMethod( items , "AddItem", "Task 1"),"Task","1/2/2001","1/4/2001","K1","K1");
	_ObjectCallMethod( items , "AddBar", _ObjectCallMethod( items , "AddItem", "Task 2"),"Task","1/2/2001","1/4/2001","A2","A2");
	_ObjectCallMethod( items , "AddBar", _ObjectCallMethod( items , "AddItem", "Task 3"),"Task","1/2/2001","1/4/2001","K3","K3");
	_ObjectCallMethod( items , "RemoveBar", 0,"<*>");
|
|
1448
|
Is it possible to update at once a property for several bars without enumerating them
OBJECT g2antt,items;

g2antt =  ObjectByName("AN1") ;
_ObjectCallMethod( _ObjectGetProperty( g2antt , "Columns") , "Add", "Tasks");
_ObjectSetProperty( _ObjectGetProperty( g2antt , "Chart") , "FirstVisibleDate", "1/1/2001");
items = _ObjectGetProperty( g2antt , "Items");
	_ObjectCallMethod( items , "AddBar", _ObjectCallMethod( items , "AddItem", "Task 1"),"Task","1/2/2001","1/4/2001","K1","K1");
	_ObjectCallMethod( items , "AddBar", _ObjectCallMethod( items , "AddItem", "Task 2"),"Task","1/2/2001","1/4/2001","A2","A2");
	_ObjectCallMethod( items , "AddBar", _ObjectCallMethod( items , "AddItem", "Task 3"),"Task","1/2/2001","1/4/2001","K3","K3");
	_ObjectCallMethod(g2antt, "TemplatePut", "Dim iteObj")
	_ObjectCallMethod(g2antt, "TemplatePut", items)
	_ObjectCallMethod(g2antt, "ExecuteTemplate", "iteObj.ItemBar(0,`<K*>`,33) = 255");
|
|
1447
|
Is it possible to update at once a property of ALL bars without enumerating them
OBJECT g2antt,items;

g2antt =  ObjectByName("AN1") ;
_ObjectCallMethod( _ObjectGetProperty( g2antt , "Columns") , "Add", "Tasks");
_ObjectSetProperty( _ObjectGetProperty( g2antt , "Chart") , "FirstVisibleDate", "1/1/2001");
items = _ObjectGetProperty( g2antt , "Items");
	_ObjectCallMethod( items , "AddBar", _ObjectCallMethod( items , "AddItem", "Task 1"),"Task","1/2/2001","1/4/2001","K1","K1");
	_ObjectCallMethod( items , "AddBar", _ObjectCallMethod( items , "AddItem", "Task 2"),"Task","1/2/2001","1/4/2001","A2","A2");
	_ObjectCallMethod( items , "AddBar", _ObjectCallMethod( items , "AddItem", "Task 3"),"Task","1/2/2001","1/4/2001","K3","K3");
	_ObjectCallMethod(g2antt, "TemplatePut", "Dim iteObj")
	_ObjectCallMethod(g2antt, "TemplatePut", items)
	_ObjectCallMethod(g2antt, "ExecuteTemplate", "iteObj.ItemBar(0,`<*>`,33) = 255");
|
|
1446
|
How do I prevent selecting a new item when selecting a bar
OBJECT chart,g2antt,items;

g2antt =  ObjectByName("AN1") ;
_ObjectCallMethod( g2antt , "BeginUpdate");
_ObjectCallMethod( _ObjectGetProperty( g2antt , "Columns") , "Add", "Task");
chart = _ObjectGetProperty( g2antt , "Chart");
	_ObjectSetProperty( chart , "FirstVisibleDate", "12/29/2000");
	_ObjectCallMethod(g2antt, "TemplatePut", "Dim chaObj")
	_ObjectCallMethod(g2antt, "TemplatePut", chart)
	_ObjectCallMethod(g2antt, "ExecuteTemplate", "chaObj.PaneWidth(False) = 64");
	_ObjectSetProperty( chart , "LevelCount", 2);
	_ObjectSetProperty( chart , "SelectOnClick", 0);
items = _ObjectGetProperty( g2antt , "Items");
	_ObjectCallMethod( items , "AddBar", _ObjectCallMethod( items , "AddItem", "Task 1"),"Task","1/2/2001","1/4/2001","K1");
	_ObjectCallMethod( items , "AddBar", _ObjectCallMethod( items , "AddItem", "Task 2"),"Task","1/4/2001","1/6/2001","K2");
	_ObjectCallMethod( items , "AddBar", _ObjectCallMethod( items , "AddItem", "Task 3"),"Task","1/8/2001","1/10/2001","K3");
	_ObjectCallMethod(g2antt, "TemplatePut", "Dim iteObj")
	_ObjectCallMethod(g2antt, "TemplatePut", items)
	_ObjectCallMethod(g2antt, "ExecuteTemplate", "iteObj.SelectItem(FirstVisibleItem) = True");
_ObjectCallMethod( g2antt , "EndUpdate");
|
|
1445
|
Is it possible to find out all incoming bars ( recursively )
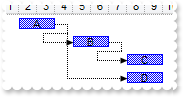
// MouseMove event - Occurs when the user moves the mouse.
FUNCTION g2anttEvents_MouseMove(OBJECT g2antt, INT Button, INT Shift, INT X, INT Y)
	_ObjectCallMethod(g2antt, "TemplatePut", "Dim _ObObj")
	_ObjectCallMethod(g2antt, "TemplatePut", _ObjectGetProperty( g2antt , "Chart"))
	b = _ObjectCallMethod(g2antt, "ExecuteTemplate", "_ObObj.BarFromPoint(-1,-1)");
	_ObjectCallMethod(g2antt, "TemplatePut", "Dim c,hit")
	_ObjectCallMethod(g2antt, "TemplatePut", c)
	_ObjectCallMethod(g2antt, "TemplatePut", hit)
	i = _ObjectCallMethod(g2antt, "ExecuteTemplate", "ItemFromPoint(-1,-1,c,hit)");
	_ObjectCallMethod(g2antt, "TemplatePut", "Dim _ObObj,b,i")
	_ObjectCallMethod(g2antt, "TemplatePut", _ObjectGetProperty( g2antt , "Items"))
	_ObjectCallMethod(g2antt, "TemplatePut", b)
	_ObjectCallMethod(g2antt, "TemplatePut", i)
	Message( _ObjectCallMethod(g2antt, "ExecuteTemplate", "_ObObj.ItemBar(i,b,542)") );
END

OBJECT chart,g2antt,items;

g2antt =  ObjectByName("AN1") ;
ObjectAssociateEvents("g2anttEvents", g2antt);
_ObjectCallMethod( g2antt , "BeginUpdate");
_ObjectCallMethod( _ObjectGetProperty( g2antt , "Columns") , "Add", "Tasks");
chart = _ObjectGetProperty( g2antt , "Chart");
	_ObjectSetProperty( chart , "LevelCount", 2);
	_ObjectSetProperty( chart , "FirstVisibleDate", "12/28/2000");
	_ObjectCallMethod(g2antt, "TemplatePut", "Dim chaObj")
	_ObjectCallMethod(g2antt, "TemplatePut", chart)
	_ObjectCallMethod(g2antt, "ExecuteTemplate", "chaObj.PaneWidth(False) = 96");
	_ObjectSetProperty( chart , "NonworkingDays", 0);
	_ObjectSetProperty( chart , "AllowLinkBars", -1);
	_ObjectSetProperty( chart , "AllowCreateBar", 1);
items = _ObjectGetProperty( g2antt , "Items");
	h1 = _ObjectCallMethod( items , "AddItem", "Task 1");
	_ObjectCallMethod( items , "AddBar", h1,"Task","1/2/2001","1/4/2001","A","A");
	h2 = _ObjectCallMethod( items , "AddItem", "Task 2");
	_ObjectCallMethod( items , "AddBar", h2,"Task","1/5/2001","1/7/2001","B","B");
	_ObjectCallMethod( items , "AddLink", "L1",h1,"A",h2,"B");
	h3 = _ObjectCallMethod( items , "AddItem", "Task 3");
	_ObjectCallMethod( items , "AddBar", h3,"Task","1/8/2001","1/10/2001","C","C");
	_ObjectCallMethod( items , "AddLink", "L2",h2,"B",h3,"C");
	h4 = _ObjectCallMethod( items , "AddItem", "Task 4");
	_ObjectCallMethod( items , "AddBar", h4,"Task","1/8/2001","1/10/2001","D","D");
	_ObjectCallMethod( items , "AddLink", "L3",h1,"A",h4,"D");
_ObjectCallMethod( g2antt , "EndUpdate");
|
|
1444
|
How do I find the incoming bars
// MouseMove event - Occurs when the user moves the mouse.
FUNCTION g2anttEvents_MouseMove(OBJECT g2antt, INT Button, INT Shift, INT X, INT Y)
	_ObjectCallMethod(g2antt, "TemplatePut", "Dim _ObObj")
	_ObjectCallMethod(g2antt, "TemplatePut", _ObjectGetProperty( g2antt , "Chart"))
	b = _ObjectCallMethod(g2antt, "ExecuteTemplate", "_ObObj.BarFromPoint(-1,-1)");
	_ObjectCallMethod(g2antt, "TemplatePut", "Dim c,hit")
	_ObjectCallMethod(g2antt, "TemplatePut", c)
	_ObjectCallMethod(g2antt, "TemplatePut", hit)
	i = _ObjectCallMethod(g2antt, "ExecuteTemplate", "ItemFromPoint(-1,-1,c,hit)");
	_ObjectCallMethod(g2antt, "TemplatePut", "Dim _ObObj,b,i")
	_ObjectCallMethod(g2antt, "TemplatePut", _ObjectGetProperty( g2antt , "Items"))
	_ObjectCallMethod(g2antt, "TemplatePut", b)
	_ObjectCallMethod(g2antt, "TemplatePut", i)
	Message( _ObjectCallMethod(g2antt, "ExecuteTemplate", "_ObObj.ItemBar(i,b,541)") );
END

OBJECT chart,g2antt,items;

g2antt =  ObjectByName("AN1") ;
ObjectAssociateEvents("g2anttEvents", g2antt);
_ObjectCallMethod( g2antt , "BeginUpdate");
_ObjectCallMethod( _ObjectGetProperty( g2antt , "Columns") , "Add", "Tasks");
chart = _ObjectGetProperty( g2antt , "Chart");
	_ObjectSetProperty( chart , "LevelCount", 2);
	_ObjectSetProperty( chart , "FirstVisibleDate", "12/28/2000");
	_ObjectCallMethod(g2antt, "TemplatePut", "Dim chaObj")
	_ObjectCallMethod(g2antt, "TemplatePut", chart)
	_ObjectCallMethod(g2antt, "ExecuteTemplate", "chaObj.PaneWidth(False) = 96");
	_ObjectSetProperty( chart , "NonworkingDays", 0);
	_ObjectSetProperty( chart , "AllowLinkBars", -1);
	_ObjectSetProperty( chart , "AllowCreateBar", 1);
items = _ObjectGetProperty( g2antt , "Items");
	h1 = _ObjectCallMethod( items , "AddItem", "Task 1");
	_ObjectCallMethod( items , "AddBar", h1,"Task","1/2/2001","1/4/2001","A","A");
	h2 = _ObjectCallMethod( items , "AddItem", "Task 2");
	_ObjectCallMethod( items , "AddBar", h2,"Task","1/5/2001","1/7/2001","B","B");
	_ObjectCallMethod( items , "AddLink", "L1",h1,"A",h2,"B");
	h3 = _ObjectCallMethod( items , "AddItem", "Task 3");
	_ObjectCallMethod( items , "AddBar", h3,"Task","1/8/2001","1/10/2001","C","C");
	_ObjectCallMethod( items , "AddLink", "L2",h2,"B",h3,"C");
	h4 = _ObjectCallMethod( items , "AddItem", "Task 4");
	_ObjectCallMethod( items , "AddBar", h4,"Task","1/8/2001","1/10/2001","D","D");
	_ObjectCallMethod( items , "AddLink", "L3",h1,"A",h4,"D");
_ObjectCallMethod( g2antt , "EndUpdate");
|
|
1443
|
Is it possible to find out all incoming links ( recursively ). Incoming link is a link from another bar to the current bar
// MouseMove event - Occurs when the user moves the mouse.
FUNCTION g2anttEvents_MouseMove(OBJECT g2antt, INT Button, INT Shift, INT X, INT Y)
	_ObjectCallMethod(g2antt, "TemplatePut", "Dim _ObObj")
	_ObjectCallMethod(g2antt, "TemplatePut", _ObjectGetProperty( g2antt , "Chart"))
	b = _ObjectCallMethod(g2antt, "ExecuteTemplate", "_ObObj.BarFromPoint(-1,-1)");
	_ObjectCallMethod(g2antt, "TemplatePut", "Dim c,hit")
	_ObjectCallMethod(g2antt, "TemplatePut", c)
	_ObjectCallMethod(g2antt, "TemplatePut", hit)
	i = _ObjectCallMethod(g2antt, "ExecuteTemplate", "ItemFromPoint(-1,-1,c,hit)");
	_ObjectCallMethod(g2antt, "TemplatePut", "Dim _ObObj,b,i")
	_ObjectCallMethod(g2antt, "TemplatePut", _ObjectGetProperty( g2antt , "Items"))
	_ObjectCallMethod(g2antt, "TemplatePut", b)
	_ObjectCallMethod(g2antt, "TemplatePut", i)
	Message( _ObjectCallMethod(g2antt, "ExecuteTemplate", "_ObObj.ItemBar(i,b,536)") );
END

OBJECT chart,g2antt,items;

g2antt =  ObjectByName("AN1") ;
ObjectAssociateEvents("g2anttEvents", g2antt);
_ObjectCallMethod( g2antt , "BeginUpdate");
_ObjectCallMethod( _ObjectGetProperty( g2antt , "Columns") , "Add", "Tasks");
chart = _ObjectGetProperty( g2antt , "Chart");
	_ObjectSetProperty( chart , "LevelCount", 2);
	_ObjectSetProperty( chart , "FirstVisibleDate", "12/28/2000");
	_ObjectCallMethod(g2antt, "TemplatePut", "Dim chaObj")
	_ObjectCallMethod(g2antt, "TemplatePut", chart)
	_ObjectCallMethod(g2antt, "ExecuteTemplate", "chaObj.PaneWidth(False) = 96");
	_ObjectSetProperty( chart , "NonworkingDays", 0);
	_ObjectSetProperty( chart , "AllowLinkBars", -1);
	_ObjectSetProperty( chart , "AllowCreateBar", 1);
items = _ObjectGetProperty( g2antt , "Items");
	h1 = _ObjectCallMethod( items , "AddItem", "Task 1");
	_ObjectCallMethod( items , "AddBar", h1,"Task","1/2/2001","1/4/2001","A","A");
	h2 = _ObjectCallMethod( items , "AddItem", "Task 2");
	_ObjectCallMethod( items , "AddBar", h2,"Task","1/5/2001","1/7/2001","B","B");
	_ObjectCallMethod( items , "AddLink", "L1",h1,"A",h2,"B");
	h3 = _ObjectCallMethod( items , "AddItem", "Task 3");
	_ObjectCallMethod( items , "AddBar", h3,"Task","1/8/2001","1/10/2001","C","C");
	_ObjectCallMethod( items , "AddLink", "L2",h2,"B",h3,"C");
	h4 = _ObjectCallMethod( items , "AddItem", "Task 4");
	_ObjectCallMethod( items , "AddBar", h4,"Task","1/8/2001","1/10/2001","D","D");
	_ObjectCallMethod( items , "AddLink", "L3",h1,"A",h4,"D");
_ObjectCallMethod( g2antt , "EndUpdate");
|
|
1442
|
How do I find the incoming links. Incoming link is link from another bar to the current bar
// MouseMove event - Occurs when the user moves the mouse.
FUNCTION g2anttEvents_MouseMove(OBJECT g2antt, INT Button, INT Shift, INT X, INT Y)
	_ObjectCallMethod(g2antt, "TemplatePut", "Dim _ObObj")
	_ObjectCallMethod(g2antt, "TemplatePut", _ObjectGetProperty( g2antt , "Chart"))
	b = _ObjectCallMethod(g2antt, "ExecuteTemplate", "_ObObj.BarFromPoint(-1,-1)");
	_ObjectCallMethod(g2antt, "TemplatePut", "Dim c,hit")
	_ObjectCallMethod(g2antt, "TemplatePut", c)
	_ObjectCallMethod(g2antt, "TemplatePut", hit)
	i = _ObjectCallMethod(g2antt, "ExecuteTemplate", "ItemFromPoint(-1,-1,c,hit)");
	_ObjectCallMethod(g2antt, "TemplatePut", "Dim _ObObj,b,i")
	_ObjectCallMethod(g2antt, "TemplatePut", _ObjectGetProperty( g2antt , "Items"))
	_ObjectCallMethod(g2antt, "TemplatePut", b)
	_ObjectCallMethod(g2antt, "TemplatePut", i)
	Message( _ObjectCallMethod(g2antt, "ExecuteTemplate", "_ObObj.ItemBar(i,b,534)") );
END

OBJECT chart,g2antt,items;

g2antt =  ObjectByName("AN1") ;
ObjectAssociateEvents("g2anttEvents", g2antt);
_ObjectCallMethod( g2antt , "BeginUpdate");
_ObjectCallMethod( _ObjectGetProperty( g2antt , "Columns") , "Add", "Tasks");
chart = _ObjectGetProperty( g2antt , "Chart");
	_ObjectSetProperty( chart , "LevelCount", 2);
	_ObjectSetProperty( chart , "FirstVisibleDate", "12/28/2000");
	_ObjectCallMethod(g2antt, "TemplatePut", "Dim chaObj")
	_ObjectCallMethod(g2antt, "TemplatePut", chart)
	_ObjectCallMethod(g2antt, "ExecuteTemplate", "chaObj.PaneWidth(False) = 96");
	_ObjectSetProperty( chart , "NonworkingDays", 0);
	_ObjectSetProperty( chart , "AllowLinkBars", -1);
	_ObjectSetProperty( chart , "AllowCreateBar", 1);
items = _ObjectGetProperty( g2antt , "Items");
	h1 = _ObjectCallMethod( items , "AddItem", "Task 1");
	_ObjectCallMethod( items , "AddBar", h1,"Task","1/2/2001","1/4/2001","A","A");
	h2 = _ObjectCallMethod( items , "AddItem", "Task 2");
	_ObjectCallMethod( items , "AddBar", h2,"Task","1/5/2001","1/7/2001","B","B");
	_ObjectCallMethod( items , "AddLink", "L1",h1,"A",h2,"B");
	h3 = _ObjectCallMethod( items , "AddItem", "Task 3");
	_ObjectCallMethod( items , "AddBar", h3,"Task","1/8/2001","1/10/2001","C","C");
	_ObjectCallMethod( items , "AddLink", "L2",h2,"B",h3,"C");
	h4 = _ObjectCallMethod( items , "AddItem", "Task 4");
	_ObjectCallMethod( items , "AddBar", h4,"Task","1/8/2001","1/10/2001","D","D");
	_ObjectCallMethod( items , "AddLink", "L3",h1,"A",h4,"D");
_ObjectCallMethod( g2antt , "EndUpdate");
|
|
1441
|
Is it possible to find out all outgoing bars ( recursively )
// MouseMove event - Occurs when the user moves the mouse.
FUNCTION g2anttEvents_MouseMove(OBJECT g2antt, INT Button, INT Shift, INT X, INT Y)
	_ObjectCallMethod(g2antt, "TemplatePut", "Dim _ObObj")
	_ObjectCallMethod(g2antt, "TemplatePut", _ObjectGetProperty( g2antt , "Chart"))
	b = _ObjectCallMethod(g2antt, "ExecuteTemplate", "_ObObj.BarFromPoint(-1,-1)");
	_ObjectCallMethod(g2antt, "TemplatePut", "Dim c,hit")
	_ObjectCallMethod(g2antt, "TemplatePut", c)
	_ObjectCallMethod(g2antt, "TemplatePut", hit)
	i = _ObjectCallMethod(g2antt, "ExecuteTemplate", "ItemFromPoint(-1,-1,c,hit)");
	_ObjectCallMethod(g2antt, "TemplatePut", "Dim _ObObj,b,i")
	_ObjectCallMethod(g2antt, "TemplatePut", _ObjectGetProperty( g2antt , "Items"))
	_ObjectCallMethod(g2antt, "TemplatePut", b)
	_ObjectCallMethod(g2antt, "TemplatePut", i)
	Message( _ObjectCallMethod(g2antt, "ExecuteTemplate", "_ObObj.ItemBar(i,b,532)") );
END

OBJECT chart,g2antt,items;

g2antt =  ObjectByName("AN1") ;
ObjectAssociateEvents("g2anttEvents", g2antt);
_ObjectCallMethod( g2antt , "BeginUpdate");
_ObjectCallMethod( _ObjectGetProperty( g2antt , "Columns") , "Add", "Tasks");
chart = _ObjectGetProperty( g2antt , "Chart");
	_ObjectSetProperty( chart , "LevelCount", 2);
	_ObjectSetProperty( chart , "FirstVisibleDate", "12/28/2000");
	_ObjectCallMethod(g2antt, "TemplatePut", "Dim chaObj")
	_ObjectCallMethod(g2antt, "TemplatePut", chart)
	_ObjectCallMethod(g2antt, "ExecuteTemplate", "chaObj.PaneWidth(False) = 96");
	_ObjectSetProperty( chart , "NonworkingDays", 0);
	_ObjectSetProperty( chart , "AllowLinkBars", -1);
	_ObjectSetProperty( chart , "AllowCreateBar", 1);
items = _ObjectGetProperty( g2antt , "Items");
	h1 = _ObjectCallMethod( items , "AddItem", "Task 1");
	_ObjectCallMethod( items , "AddBar", h1,"Task","1/2/2001","1/4/2001","A","A");
	h2 = _ObjectCallMethod( items , "AddItem", "Task 2");
	_ObjectCallMethod( items , "AddBar", h2,"Task","1/5/2001","1/7/2001","B","B");
	_ObjectCallMethod( items , "AddLink", "L1",h1,"A",h2,"B");
	h3 = _ObjectCallMethod( items , "AddItem", "Task 3");
	_ObjectCallMethod( items , "AddBar", h3,"Task","1/8/2001","1/10/2001","C","C");
	_ObjectCallMethod( items , "AddLink", "L2",h2,"B",h3,"C");
	h4 = _ObjectCallMethod( items , "AddItem", "Task 4");
	_ObjectCallMethod( items , "AddBar", h4,"Task","1/8/2001","1/10/2001","D","D");
	_ObjectCallMethod( items , "AddLink", "L3",h1,"A",h4,"D");
_ObjectCallMethod( g2antt , "EndUpdate");
|
|
1440
|
How do I find the outgoing bars
// MouseMove event - Occurs when the user moves the mouse.
FUNCTION g2anttEvents_MouseMove(OBJECT g2antt, INT Button, INT Shift, INT X, INT Y)
	_ObjectCallMethod(g2antt, "TemplatePut", "Dim _ObObj")
	_ObjectCallMethod(g2antt, "TemplatePut", _ObjectGetProperty( g2antt , "Chart"))
	b = _ObjectCallMethod(g2antt, "ExecuteTemplate", "_ObObj.BarFromPoint(-1,-1)");
	_ObjectCallMethod(g2antt, "TemplatePut", "Dim c,hit")
	_ObjectCallMethod(g2antt, "TemplatePut", c)
	_ObjectCallMethod(g2antt, "TemplatePut", hit)
	i = _ObjectCallMethod(g2antt, "ExecuteTemplate", "ItemFromPoint(-1,-1,c,hit)");
	_ObjectCallMethod(g2antt, "TemplatePut", "Dim _ObObj,b,i")
	_ObjectCallMethod(g2antt, "TemplatePut", _ObjectGetProperty( g2antt , "Items"))
	_ObjectCallMethod(g2antt, "TemplatePut", b)
	_ObjectCallMethod(g2antt, "TemplatePut", i)
	Message( _ObjectCallMethod(g2antt, "ExecuteTemplate", "_ObObj.ItemBar(i,b,531)") );
END

OBJECT chart,g2antt,items;

g2antt =  ObjectByName("AN1") ;
ObjectAssociateEvents("g2anttEvents", g2antt);
_ObjectCallMethod( g2antt , "BeginUpdate");
_ObjectCallMethod( _ObjectGetProperty( g2antt , "Columns") , "Add", "Tasks");
chart = _ObjectGetProperty( g2antt , "Chart");
	_ObjectSetProperty( chart , "LevelCount", 2);
	_ObjectSetProperty( chart , "FirstVisibleDate", "12/28/2000");
	_ObjectCallMethod(g2antt, "TemplatePut", "Dim chaObj")
	_ObjectCallMethod(g2antt, "TemplatePut", chart)
	_ObjectCallMethod(g2antt, "ExecuteTemplate", "chaObj.PaneWidth(False) = 96");
	_ObjectSetProperty( chart , "NonworkingDays", 0);
	_ObjectSetProperty( chart , "AllowLinkBars", -1);
	_ObjectSetProperty( chart , "AllowCreateBar", 1);
items = _ObjectGetProperty( g2antt , "Items");
	h1 = _ObjectCallMethod( items , "AddItem", "Task 1");
	_ObjectCallMethod( items , "AddBar", h1,"Task","1/2/2001","1/4/2001","A","A");
	h2 = _ObjectCallMethod( items , "AddItem", "Task 2");
	_ObjectCallMethod( items , "AddBar", h2,"Task","1/5/2001","1/7/2001","B","B");
	_ObjectCallMethod( items , "AddLink", "L1",h1,"A",h2,"B");
	h3 = _ObjectCallMethod( items , "AddItem", "Task 3");
	_ObjectCallMethod( items , "AddBar", h3,"Task","1/8/2001","1/10/2001","C","C");
	_ObjectCallMethod( items , "AddLink", "L2",h2,"B",h3,"C");
	h4 = _ObjectCallMethod( items , "AddItem", "Task 4");
	_ObjectCallMethod( items , "AddBar", h4,"Task","1/8/2001","1/10/2001","D","D");
	_ObjectCallMethod( items , "AddLink", "L3",h1,"A",h4,"D");
_ObjectCallMethod( g2antt , "EndUpdate");
|
|
1439
|
Is it possible to find out all outgoing links ( recursively ). Outgoing link is link from a bar to another bar
// MouseMove event - Occurs when the user moves the mouse.
FUNCTION g2anttEvents_MouseMove(OBJECT g2antt, INT Button, INT Shift, INT X, INT Y)
	_ObjectCallMethod(g2antt, "TemplatePut", "Dim _ObObj")
	_ObjectCallMethod(g2antt, "TemplatePut", _ObjectGetProperty( g2antt , "Chart"))
	b = _ObjectCallMethod(g2antt, "ExecuteTemplate", "_ObObj.BarFromPoint(-1,-1)");
	_ObjectCallMethod(g2antt, "TemplatePut", "Dim c,hit")
	_ObjectCallMethod(g2antt, "TemplatePut", c)
	_ObjectCallMethod(g2antt, "TemplatePut", hit)
	i = _ObjectCallMethod(g2antt, "ExecuteTemplate", "ItemFromPoint(-1,-1,c,hit)");
	_ObjectCallMethod(g2antt, "TemplatePut", "Dim _ObObj,b,i")
	_ObjectCallMethod(g2antt, "TemplatePut", _ObjectGetProperty( g2antt , "Items"))
	_ObjectCallMethod(g2antt, "TemplatePut", b)
	_ObjectCallMethod(g2antt, "TemplatePut", i)
	Message( _ObjectCallMethod(g2antt, "ExecuteTemplate", "_ObObj.ItemBar(i,b,526)") );
END

OBJECT chart,g2antt,items;

g2antt =  ObjectByName("AN1") ;
ObjectAssociateEvents("g2anttEvents", g2antt);
_ObjectCallMethod( g2antt , "BeginUpdate");
_ObjectCallMethod( _ObjectGetProperty( g2antt , "Columns") , "Add", "Tasks");
chart = _ObjectGetProperty( g2antt , "Chart");
	_ObjectSetProperty( chart , "LevelCount", 2);
	_ObjectSetProperty( chart , "FirstVisibleDate", "12/28/2000");
	_ObjectCallMethod(g2antt, "TemplatePut", "Dim chaObj")
	_ObjectCallMethod(g2antt, "TemplatePut", chart)
	_ObjectCallMethod(g2antt, "ExecuteTemplate", "chaObj.PaneWidth(False) = 96");
	_ObjectSetProperty( chart , "NonworkingDays", 0);
	_ObjectSetProperty( chart , "AllowLinkBars", -1);
	_ObjectSetProperty( chart , "AllowCreateBar", 1);
items = _ObjectGetProperty( g2antt , "Items");
	h1 = _ObjectCallMethod( items , "AddItem", "Task 1");
	_ObjectCallMethod( items , "AddBar", h1,"Task","1/2/2001","1/4/2001","A","A");
	h2 = _ObjectCallMethod( items , "AddItem", "Task 2");
	_ObjectCallMethod( items , "AddBar", h2,"Task","1/5/2001","1/7/2001","B","B");
	_ObjectCallMethod( items , "AddLink", "L1",h1,"A",h2,"B");
	h3 = _ObjectCallMethod( items , "AddItem", "Task 3");
	_ObjectCallMethod( items , "AddBar", h3,"Task","1/8/2001","1/10/2001","C","C");
	_ObjectCallMethod( items , "AddLink", "L2",h2,"B",h3,"C");
	h4 = _ObjectCallMethod( items , "AddItem", "Task 4");
	_ObjectCallMethod( items , "AddBar", h4,"Task","1/8/2001","1/10/2001","D","D");
	_ObjectCallMethod( items , "AddLink", "L3",h1,"A",h4,"D");
_ObjectCallMethod( g2antt , "EndUpdate");
|
|
1438
|
How do I find the outgoing links. Outgoing link is link from a bar to another bar
// MouseMove event - Occurs when the user moves the mouse.
FUNCTION g2anttEvents_MouseMove(OBJECT g2antt, INT Button, INT Shift, INT X, INT Y)
	_ObjectCallMethod(g2antt, "TemplatePut", "Dim _ObObj")
	_ObjectCallMethod(g2antt, "TemplatePut", _ObjectGetProperty( g2antt , "Chart"))
	b = _ObjectCallMethod(g2antt, "ExecuteTemplate", "_ObObj.BarFromPoint(-1,-1)");
	_ObjectCallMethod(g2antt, "TemplatePut", "Dim c,hit")
	_ObjectCallMethod(g2antt, "TemplatePut", c)
	_ObjectCallMethod(g2antt, "TemplatePut", hit)
	i = _ObjectCallMethod(g2antt, "ExecuteTemplate", "ItemFromPoint(-1,-1,c,hit)");
	_ObjectCallMethod(g2antt, "TemplatePut", "Dim _ObObj,b,i")
	_ObjectCallMethod(g2antt, "TemplatePut", _ObjectGetProperty( g2antt , "Items"))
	_ObjectCallMethod(g2antt, "TemplatePut", b)
	_ObjectCallMethod(g2antt, "TemplatePut", i)
	Message( _ObjectCallMethod(g2antt, "ExecuteTemplate", "_ObObj.ItemBar(i,b,524)") );
END

OBJECT chart,g2antt,items;

g2antt =  ObjectByName("AN1") ;
ObjectAssociateEvents("g2anttEvents", g2antt);
_ObjectCallMethod( g2antt , "BeginUpdate");
_ObjectCallMethod( _ObjectGetProperty( g2antt , "Columns") , "Add", "Tasks");
chart = _ObjectGetProperty( g2antt , "Chart");
	_ObjectSetProperty( chart , "LevelCount", 2);
	_ObjectSetProperty( chart , "FirstVisibleDate", "12/28/2000");
	_ObjectCallMethod(g2antt, "TemplatePut", "Dim chaObj")
	_ObjectCallMethod(g2antt, "TemplatePut", chart)
	_ObjectCallMethod(g2antt, "ExecuteTemplate", "chaObj.PaneWidth(False) = 96");
	_ObjectSetProperty( chart , "NonworkingDays", 0);
	_ObjectSetProperty( chart , "AllowLinkBars", -1);
	_ObjectSetProperty( chart , "AllowCreateBar", 1);
items = _ObjectGetProperty( g2antt , "Items");
	h1 = _ObjectCallMethod( items , "AddItem", "Task 1");
	_ObjectCallMethod( items , "AddBar", h1,"Task","1/2/2001","1/4/2001","A","A");
	h2 = _ObjectCallMethod( items , "AddItem", "Task 2");
	_ObjectCallMethod( items , "AddBar", h2,"Task","1/5/2001","1/7/2001","B","B");
	_ObjectCallMethod( items , "AddLink", "L1",h1,"A",h2,"B");
	h3 = _ObjectCallMethod( items , "AddItem", "Task 3");
	_ObjectCallMethod( items , "AddBar", h3,"Task","1/8/2001","1/10/2001","C","C");
	_ObjectCallMethod( items , "AddLink", "L2",h2,"B",h3,"C");
	h4 = _ObjectCallMethod( items , "AddItem", "Task 4");
	_ObjectCallMethod( items , "AddBar", h4,"Task","1/8/2001","1/10/2001","D","D");
	_ObjectCallMethod( items , "AddLink", "L3",h1,"A",h4,"D");
_ObjectCallMethod( g2antt , "EndUpdate");
|
|
1437
|
How do I select a bar using the right-click
// MouseDown event - Occurs when the user presses a mouse button.
FUNCTION g2anttEvents_MouseDown(OBJECT g2antt, INT Button, INT Shift, INT X, INT Y)
	OBJECT items;
	items = _ObjectGetProperty( g2antt , "Items");
		_ObjectCallMethod(g2antt, "TemplatePut", "Dim iteObj")
		_ObjectCallMethod(g2antt, "TemplatePut", items)
		_ObjectCallMethod(g2antt, "ExecuteTemplate", "iteObj.ItemBar(0,`<*>`,257) = False");
		_ObjectCallMethod(g2antt, "TemplatePut", "Dim iteObj,c,hit")
		_ObjectCallMethod(g2antt, "TemplatePut", items)
		_ObjectCallMethod(g2antt, "TemplatePut", c)
		_ObjectCallMethod(g2antt, "TemplatePut", hit)
		_ObjectCallMethod(g2antt, "ExecuteTemplate", "iteObj.ItemBar(Me.ItemFromPoint(-1,-1,c,hit),Me.Chart.BarFromPoint(-1,-1),257) = True");
END

OBJECT chart,g2antt,items;

g2antt =  ObjectByName("AN1") ;
ObjectAssociateEvents("g2anttEvents", g2antt);
_ObjectCallMethod( g2antt , "BeginUpdate");
_ObjectCallMethod( _ObjectGetProperty( g2antt , "Columns") , "Add", "Task");
chart = _ObjectGetProperty( g2antt , "Chart");
	_ObjectSetProperty( chart , "FirstVisibleDate", "12/29/2000");
	_ObjectCallMethod(g2antt, "TemplatePut", "Dim chaObj")
	_ObjectCallMethod(g2antt, "TemplatePut", chart)
	_ObjectCallMethod(g2antt, "ExecuteTemplate", "chaObj.PaneWidth(False) = 64");
	_ObjectSetProperty( chart , "LevelCount", 2);
items = _ObjectGetProperty( g2antt , "Items");
	_ObjectCallMethod( items , "AddBar", _ObjectCallMethod( items , "AddItem", "Task 1"),"Task","1/2/2001","1/4/2001","K1");
	_ObjectCallMethod( items , "AddBar", _ObjectCallMethod( items , "AddItem", "Task 2"),"Task","1/4/2001","1/6/2001","K2");
	_ObjectCallMethod( items , "AddBar", _ObjectCallMethod( items , "AddItem", "Task 3"),"Task","1/8/2001","1/10/2001","K3");
_ObjectCallMethod( g2antt , "EndUpdate");
|
|
1436
|
How can I add or change the padding (spaces) for captions in the control's header
OBJECT column,g2antt;

g2antt =  ObjectByName("AN1") ;
_ObjectCallMethod( g2antt , "BeginUpdate");
_ObjectCallMethod(g2antt, "ExecuteTemplate", "Columns.Add(`Padding-Left`).Def(52) = 18");
column = _ObjectCallMethod( _ObjectGetProperty( g2antt , "Columns") , "Add", "Padding-Right");
	_ObjectCallMethod(g2antt, "TemplatePut", "Dim colObj")
	_ObjectCallMethod(g2antt, "TemplatePut", column)
	_ObjectCallMethod(g2antt, "ExecuteTemplate", "colObj.Def(53) = 18");
	_ObjectSetProperty( column , "HeaderAlignment", 2);
_ObjectCallMethod( g2antt , "EndUpdate");
|
|
1435
|
Do you have any plans to add cell spacing and cell padding to the cells
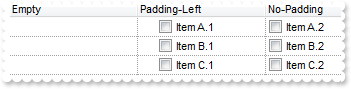
OBJECT column,g2antt,items;

g2antt =  ObjectByName("AN1") ;
_ObjectCallMethod( g2antt , "BeginUpdate");
_ObjectSetProperty( g2antt , "DrawGridLines", -2);
column = _ObjectCallMethod( _ObjectGetProperty( g2antt , "Columns") , "Add", "Padding-Left");
	_ObjectCallMethod(g2antt, "TemplatePut", "Dim colObj")
	_ObjectCallMethod(g2antt, "TemplatePut", column)
	_ObjectCallMethod(g2antt, "ExecuteTemplate", "colObj.Def(0) = True");
	_ObjectCallMethod(g2antt, "ExecuteTemplate", "colObj.Def(48) = 18");
_ObjectCallMethod(g2antt, "ExecuteTemplate", "Columns.Add(`No-Padding`).Def(0) = True");
_ObjectSetProperty( _ObjectCallMethod( _ObjectGetProperty( g2antt , "Columns") , "Add", "Empty") , "Position", 0);
items = _ObjectGetProperty( g2antt , "Items");
	_ObjectCallMethod(g2antt, "TemplatePut", "Dim iteObj")
	_ObjectCallMethod(g2antt, "TemplatePut", items)
	_ObjectCallMethod(g2antt, "ExecuteTemplate", "iteObj.CellValue(AddItem(`Item A.1`),1) = `Item A.2`");
	_ObjectCallMethod(g2antt, "ExecuteTemplate", "iteObj.CellValue(AddItem(`Item B.1`),1) = `Item B.2`");
	_ObjectCallMethod(g2antt, "ExecuteTemplate", "iteObj.CellValue(AddItem(`Item C.1`),1) = `Item C.2`");
_ObjectCallMethod( g2antt , "EndUpdate");
|
|
1434
|
Can I display somehow the filter just on the top of the list, with an editor associated to each column
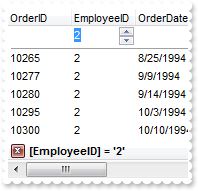
// AddItem event - Occurs after a new Item has been inserted to Items collection.
FUNCTION g2anttEvents_AddItem(OBJECT g2antt, INT Item)
	OBJECT items;
	items = _ObjectGetProperty( g2antt , "Items");
		_ObjectCallMethod(g2antt, "TemplatePut", "Dim iteObj,Item")
		_ObjectCallMethod(g2antt, "TemplatePut", items)
		_ObjectCallMethod(g2antt, "TemplatePut", Item)
		_ObjectCallMethod( items , "AddBar", Item,"Task",_ObjectCallMethod(g2antt, "ExecuteTemplate", "iteObj.CellValue(Item,2)"),_ObjectCallMethod(g2antt, "ExecuteTemplate", "iteObj.CellValue(Item,4)"));
END

// Change event - Occurs when the user changes the cell's content.
FUNCTION g2anttEvents_Change(OBJECT g2antt, INT Item, INT ColIndex, VARIANT NewValue)
	OBJECT column;
	_ObjectCallMethod(g2antt, "TemplatePut", "Dim _ObObj,Item")
	_ObjectCallMethod(g2antt, "TemplatePut", _ObjectGetProperty( g2antt , "Items"))
	_ObjectCallMethod(g2antt, "TemplatePut", Item)
	Message( "Locked:" );
	Message( _ObjectCallMethod(g2antt, "ExecuteTemplate", "_ObObj.IsItemLocked(Item)") );
	column = _ObjectCallMethod(g2antt, "ExecuteTemplate", "Columns.Item(ColIndex)");
		_ObjectSetProperty( column , "Filter", NewValue);
		_ObjectSetProperty( column , "FilterType", 3);
	_ObjectCallMethod( g2antt , "ApplyFilter");
END

// MouseUp event - Occurs when the user releases a mouse button.
FUNCTION g2anttEvents_MouseUp(OBJECT g2antt, INT Button, INT Shift, INT X, INT Y)
	_ObjectCallMethod(g2antt, "TemplatePut", "Dim _ObObj")
	_ObjectCallMethod(g2antt, "TemplatePut", _ObjectGetProperty( g2antt , "Items"))
	_ObjectCallMethod( g2antt , "Edit", _ObjectCallMethod(g2antt, "ExecuteTemplate", "_ObObj.LockedItem(0,0)"));
END

OBJECT g2antt,items,rs;

g2antt =  ObjectByName("AN1") ;
ObjectAssociateEvents("g2anttEvents", g2antt);
_ObjectSetProperty( g2antt , "ColumnAutoResize", 0);
_ObjectSetProperty( g2antt , "ScrollBySingleLine", -1);
_ObjectSetProperty( g2antt , "ContinueColumnScroll", 0);
_ObjectSetProperty( _ObjectGetProperty( g2antt , "Chart") , "FirstVisibleDate", "8/3/1994");
rs = CreateObject("ADOR.Recordset");
	_ObjectCallMethod( rs , "Open", "Orders","Provider=Microsoft.ACE.OLEDB.12.0;Data Source=C:\Program Files\Exontrol\ExG2antt\Sample\Access\misc.accdb",3,3);
_ObjectSetProperty( g2antt , "DataSource", rs);
items = _ObjectGetProperty( g2antt , "Items");
	_ObjectCallMethod(g2antt, "TemplatePut", "Dim iteObj")
	_ObjectCallMethod(g2antt, "TemplatePut", items)
	_ObjectCallMethod(g2antt, "ExecuteTemplate", "iteObj.LockedItemCount(0) = 2");
	h = _ObjectCallMethod(g2antt, "ExecuteTemplate", "iteObj.LockedItem(0,0)");
	_ObjectCallMethod(g2antt, "TemplatePut", "Dim iteObj,h")
	_ObjectCallMethod(g2antt, "TemplatePut", items)
	_ObjectCallMethod(g2antt, "TemplatePut", h)
	_ObjectCallMethod(g2antt, "ExecuteTemplate", "iteObj.CellEditor(h,0).EditType = 1");
	_ObjectCallMethod(g2antt, "TemplatePut", "Dim iteObj")
	_ObjectCallMethod(g2antt, "TemplatePut", items)
	h = _ObjectCallMethod(g2antt, "ExecuteTemplate", "iteObj.LockedItem(0,1)");
	_ObjectCallMethod(g2antt, "TemplatePut", "Dim iteObj,h")
	_ObjectCallMethod(g2antt, "TemplatePut", items)
	_ObjectCallMethod(g2antt, "TemplatePut", h)
	_ObjectCallMethod(g2antt, "ExecuteTemplate", "iteObj.ItemHeight(h) = 4");
	_ObjectCallMethod(g2antt, "ExecuteTemplate", "iteObj.ItemDivider(h) = 0");
	_ObjectCallMethod(g2antt, "ExecuteTemplate", "iteObj.SelectableItem(h) = False");
|
|
1433
|
Is it possible to display information about the firing events
// Event event - Notifies the application once the control fires an event.
FUNCTION g2anttEvents_Event(OBJECT g2antt, INT EventID)
	Message( _ObjectCallMethod(g2antt, "ExecuteTemplate", "EventParam(-2)") );
END
|
|
1432
|
I need to specify the start and end dates of the bar to be the same, but to keep count of the working units. Is it possible
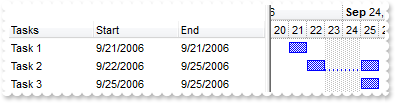
OBJECT chart,columns,g2antt,items;

g2antt =  ObjectByName("AN1") ;
_ObjectCallMethod( g2antt , "BeginUpdate");
_ObjectSetProperty( g2antt , "MarkSearchColumn", 0);
columns = _ObjectGetProperty( g2antt , "Columns");
	_ObjectCallMethod( columns , "Add", "Tasks");
	_ObjectCallMethod(g2antt, "TemplatePut", "Dim colObj")
	_ObjectCallMethod(g2antt, "TemplatePut", columns)
	_ObjectCallMethod(g2antt, "ExecuteTemplate", "colObj.Add(`Start`).Def(18) = 1");
	_ObjectCallMethod(g2antt, "ExecuteTemplate", "colObj.Add(`End`).Def(18) = 543");
chart = _ObjectGetProperty( g2antt , "Chart");
	_ObjectSetProperty( chart , "FirstVisibleDate", "9/20/2006");
	_ObjectSetProperty( chart , "LevelCount", 2);
	_ObjectCallMethod(g2antt, "TemplatePut", "Dim chaObj")
	_ObjectCallMethod(g2antt, "TemplatePut", chart)
	_ObjectCallMethod(g2antt, "ExecuteTemplate", "chaObj.PaneWidth(0) = 256");
	_ObjectSetProperty( chart , "ShowEmptyBars", 1);
	_ObjectSetProperty( _ObjectCallMethod( _ObjectGetProperty( chart , "Bars") , "Add", "Task:Split") , "Shortcut", "Task");
items = _ObjectGetProperty( g2antt , "Items");
	_ObjectSetProperty( items , "AllowCellValueToItemBar", -1);
	_ObjectCallMethod( items , "AddBar", _ObjectCallMethod( items , "AddItem", "Task 1"),"Task","9/21/2006","9/21/2006");
	_ObjectCallMethod( items , "AddBar", _ObjectCallMethod( items , "AddItem", "Task 2"),"Task","9/22/2006","9/25/2006");
	_ObjectCallMethod( items , "AddBar", _ObjectCallMethod( items , "AddItem", "Task 3"),"Task","9/25/2006","9/25/2006");
	_ObjectCallMethod(g2antt, "TemplatePut", "Dim iteObj")
	_ObjectCallMethod(g2antt, "TemplatePut", items)
	_ObjectCallMethod(g2antt, "ExecuteTemplate", "iteObj.ItemBar(0,`<*>`,20) = True");
_ObjectCallMethod( g2antt , "EndUpdate");
|
|
1431
|
I need to specify the start and end dates of the bar to be the same, but no bars are shown. (NOT recommended for bars with exBarKeepWorkingCount ) What I can do
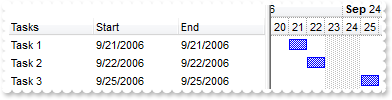
OBJECT chart,columns,g2antt,items;

g2antt =  ObjectByName("AN1") ;
_ObjectCallMethod( g2antt , "BeginUpdate");
_ObjectSetProperty( g2antt , "MarkSearchColumn", 0);
columns = _ObjectGetProperty( g2antt , "Columns");
	_ObjectCallMethod( columns , "Add", "Tasks");
	_ObjectCallMethod(g2antt, "TemplatePut", "Dim colObj")
	_ObjectCallMethod(g2antt, "TemplatePut", columns)
	_ObjectCallMethod(g2antt, "ExecuteTemplate", "colObj.Add(`Start`).Def(18) = 1");
	_ObjectCallMethod(g2antt, "ExecuteTemplate", "colObj.Add(`End`).Def(18) = 543");
chart = _ObjectGetProperty( g2antt , "Chart");
	_ObjectSetProperty( chart , "FirstVisibleDate", "9/20/2006");
	_ObjectSetProperty( chart , "LevelCount", 2);
	_ObjectCallMethod(g2antt, "TemplatePut", "Dim chaObj")
	_ObjectCallMethod(g2antt, "TemplatePut", chart)
	_ObjectCallMethod(g2antt, "ExecuteTemplate", "chaObj.PaneWidth(0) = 256");
	_ObjectSetProperty( chart , "ShowEmptyBars", 1);
items = _ObjectGetProperty( g2antt , "Items");
	_ObjectSetProperty( items , "AllowCellValueToItemBar", -1);
	_ObjectCallMethod( items , "AddBar", _ObjectCallMethod( items , "AddItem", "Task 1"),"Task","9/21/2006","9/21/2006");
	_ObjectCallMethod( items , "AddBar", _ObjectCallMethod( items , "AddItem", "Task 2"),"Task","9/22/2006","9/22/2006");
	_ObjectCallMethod( items , "AddBar", _ObjectCallMethod( items , "AddItem", "Task 3"),"Task","9/25/2006","9/25/2006");
_ObjectCallMethod( g2antt , "EndUpdate");
|
|
1430
|
I need my chart to display the end date with on day less. How can I do this (Method 2)
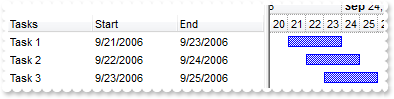
OBJECT chart,column,columns,g2antt,items;

g2antt =  ObjectByName("AN1") ;
_ObjectCallMethod( g2antt , "BeginUpdate");
_ObjectSetProperty( g2antt , "MarkSearchColumn", 0);
columns = _ObjectGetProperty( g2antt , "Columns");
	_ObjectCallMethod( columns , "Add", "Tasks");
	column = _ObjectCallMethod( columns , "Add", "Start");
		_ObjectCallMethod(g2antt, "TemplatePut", "Dim colObj")
		_ObjectCallMethod(g2antt, "TemplatePut", column)
		_ObjectCallMethod(g2antt, "ExecuteTemplate", "colObj.Def(18) = 1");
		_ObjectSetProperty( _ObjectGetProperty( column , "Editor") , "EditType", 7);
	column = _ObjectCallMethod( columns , "Add", "End");
		_ObjectCallMethod(g2antt, "ExecuteTemplate", "colObj.Def(18) = 543");
		_ObjectSetProperty( _ObjectGetProperty( column , "Editor") , "EditType", 7);
chart = _ObjectGetProperty( g2antt , "Chart");
	_ObjectSetProperty( chart , "FirstVisibleDate", "9/20/2006");
	_ObjectSetProperty( chart , "LevelCount", 2);
	_ObjectCallMethod(g2antt, "TemplatePut", "Dim chaObj")
	_ObjectCallMethod(g2antt, "TemplatePut", chart)
	_ObjectCallMethod(g2antt, "ExecuteTemplate", "chaObj.PaneWidth(0) = 256");
	_ObjectSetProperty( chart , "NonworkingDays", 0);
items = _ObjectGetProperty( g2antt , "Items");
	_ObjectSetProperty( items , "AllowCellValueToItemBar", -1);
	_ObjectCallMethod( items , "AddBar", _ObjectCallMethod( items , "AddItem", "Task 1"),"Task","9/21/2006","9/24/2006");
	_ObjectCallMethod( items , "AddBar", _ObjectCallMethod( items , "AddItem", "Task 2"),"Task","9/22/2006","9/25/2006");
	_ObjectCallMethod( items , "AddBar", _ObjectCallMethod( items , "AddItem", "Task 3"),"Task","9/23/2006","9/26/2006");
_ObjectCallMethod( g2antt , "EndUpdate");
|
|
1429
|
Is it possible to change the width of a specified time unit
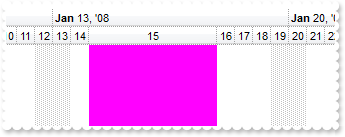
OBJECT chart,g2antt,insidezoom,insidezooms;

g2antt =  ObjectByName("AN1") ;
_ObjectCallMethod( g2antt , "BeginUpdate");
chart = _ObjectGetProperty( g2antt , "Chart");
	_ObjectCallMethod(g2antt, "TemplatePut", "Dim chaObj")
	_ObjectCallMethod(g2antt, "TemplatePut", chart)
	_ObjectCallMethod(g2antt, "ExecuteTemplate", "chaObj.PaneWidth(False) = 0");
	_ObjectSetProperty( chart , "LevelCount", 2);
	_ObjectSetProperty( chart , "FirstVisibleDate", "1/1/2008");
	_ObjectSetProperty( chart , "AllowInsideZoom", -1);
	_ObjectSetProperty( chart , "AllowResizeInsideZoom", 0);
	_ObjectSetProperty( chart , "InsideZoomOnDblClick", 0);
	_ObjectSetProperty( _ObjectGetProperty( chart , "DefaultInsideZoomFormat") , "BackColorChart", 16711935);
	insidezooms = _ObjectGetProperty( chart , "InsideZooms");
		_ObjectSetProperty( insidezooms , "SplitBaseLevel", 0);
		_ObjectSetProperty( insidezooms , "DefaultWidth", 18);
		insidezoom = _ObjectCallMethod( insidezooms , "Add", "1/15/2008");
			_ObjectSetProperty( insidezoom , "AllowInsideFormat", 0);
			_ObjectSetProperty( insidezoom , "Width", 128);
_ObjectCallMethod( g2antt , "EndUpdate");
|
|
1428
|
The level unit of the chart is set to day, so i'd like to set the whole background of the current day. Is it possible to set a background color only on the current day (Method 2)
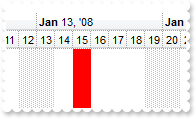
OBJECT chart,g2antt,insidezooms;

g2antt =  ObjectByName("AN1") ;
_ObjectCallMethod( g2antt , "BeginUpdate");
chart = _ObjectGetProperty( g2antt , "Chart");
	_ObjectCallMethod(g2antt, "TemplatePut", "Dim chaObj")
	_ObjectCallMethod(g2antt, "TemplatePut", chart)
	_ObjectCallMethod(g2antt, "ExecuteTemplate", "chaObj.PaneWidth(False) = 0");
	_ObjectSetProperty( chart , "LevelCount", 2);
	_ObjectSetProperty( chart , "FirstVisibleDate", "1/1/2008");
	_ObjectSetProperty( chart , "AllowInsideZoom", -1);
	_ObjectSetProperty( chart , "AllowResizeInsideZoom", 0);
	_ObjectSetProperty( chart , "InsideZoomOnDblClick", 0);
	_ObjectSetProperty( _ObjectGetProperty( chart , "DefaultInsideZoomFormat") , "BackColorChart", 255);
	insidezooms = _ObjectGetProperty( chart , "InsideZooms");
		_ObjectSetProperty( insidezooms , "SplitBaseLevel", 0);
		_ObjectSetProperty( insidezooms , "DefaultWidth", 18);
		_ObjectSetProperty( _ObjectCallMethod( insidezooms , "Add", "1/15/2008") , "AllowInsideFormat", 0);
_ObjectCallMethod( g2antt , "EndUpdate");
|
|
1427
|
The level unit of the chart is set to day, so i'd like to set the whole background of the current day. Is it possible to set a background color only on the current day (Method 1)
OBJECT chart,g2antt;

g2antt =  ObjectByName("AN1") ;
_ObjectCallMethod( g2antt , "BeginUpdate");
chart = _ObjectGetProperty( g2antt , "Chart");
	_ObjectCallMethod(g2antt, "TemplatePut", "Dim chaObj")
	_ObjectCallMethod(g2antt, "TemplatePut", chart)
	_ObjectCallMethod(g2antt, "ExecuteTemplate", "chaObj.PaneWidth(False) = 0");
	_ObjectSetProperty( chart , "FirstVisibleDate", "1/1/2008");
	_ObjectSetProperty( chart , "MarkTodayColor", _ObjectGetProperty( chart , "BackColor"));
	_ObjectSetProperty( chart , "LevelCount", 2);
	_ObjectSetProperty( chart , "MarkSelectDateColor", 2147418112);
	_ObjectSetProperty( chart , "SelectLevel", 1);
	_ObjectCallMethod(g2antt, "ExecuteTemplate", "chaObj.SelectDate(#1/15/2008#) = True");
_ObjectCallMethod( g2antt , "EndUpdate");
|
|
1426
|
How can I change the layout of my columns when using the exCRD
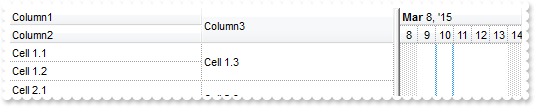
OBJECT column,columns,g2antt,items;

g2antt =  ObjectByName("AN1") ;
_ObjectCallMethod( g2antt , "BeginUpdate");
_ObjectSetProperty( g2antt , "DrawGridLines", -2);
_ObjectSetProperty( g2antt , "DefaultItemHeight", 36);
columns = _ObjectGetProperty( g2antt , "Columns");
	column = _ObjectCallMethod( columns , "Add", "Column1");
		_ObjectSetProperty( column , "Visible", 0);
		_ObjectSetProperty( _ObjectGetProperty( column , "Editor") , "EditType", 1);
	column = _ObjectCallMethod( columns , "Add", "Column2");
		_ObjectSetProperty( column , "Visible", 0);
		_ObjectSetProperty( _ObjectGetProperty( column , "Editor") , "EditType", 1);
	_ObjectSetProperty( _ObjectCallMethod( columns , "Add", "Column3") , "Visible", 0);
	column = _ObjectCallMethod( columns , "Add", "FormatLevel");
		_ObjectSetProperty( column , "FormatLevel", "(0/1),2");
		_ObjectCallMethod(g2antt, "TemplatePut", "Dim colObj")
		_ObjectCallMethod(g2antt, "TemplatePut", column)
		_ObjectCallMethod(g2antt, "ExecuteTemplate", "colObj.Def(32) = FormatLevel");
items = _ObjectGetProperty( g2antt , "Items");
	h = _ObjectCallMethod( items , "AddItem", "Cell 1.1");
	_ObjectCallMethod(g2antt, "TemplatePut", "Dim iteObj,h")
	_ObjectCallMethod(g2antt, "TemplatePut", items)
	_ObjectCallMethod(g2antt, "TemplatePut", h)
	_ObjectCallMethod(g2antt, "ExecuteTemplate", "iteObj.CellValue(h,1) = `Cell 1.2`");
	_ObjectCallMethod(g2antt, "ExecuteTemplate", "iteObj.CellValue(h,2) = `Cell 1.3`");
	h = _ObjectCallMethod( items , "AddItem", "Cell 2.1");
	_ObjectCallMethod(g2antt, "ExecuteTemplate", "iteObj.CellValue(h,1) = `Cell 2.2`");
	_ObjectCallMethod(g2antt, "ExecuteTemplate", "iteObj.CellValue(h,2) = `Cell 2.3`");
_ObjectCallMethod( g2antt , "EndUpdate");
|
|
1425
|
How can I overlaid a single bar
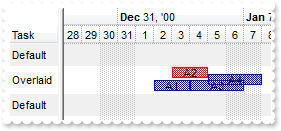
OBJECT bar,chart,g2antt,items;

g2antt =  ObjectByName("AN1") ;
_ObjectCallMethod( g2antt , "BeginUpdate");
_ObjectSetProperty( g2antt , "DefaultItemHeight", 22);
_ObjectCallMethod( _ObjectGetProperty( g2antt , "Columns") , "Add", "Task");
_ObjectSetProperty( g2antt , "ScrollBySingleLine", -1);
_ObjectSetProperty( g2antt , "BackColorAlternate", 15790320);
chart = _ObjectGetProperty( g2antt , "Chart");
	_ObjectSetProperty( chart , "AllowCreateBar", 1);
	_ObjectCallMethod(g2antt, "TemplatePut", "Dim chaObj")
	_ObjectCallMethod(g2antt, "TemplatePut", chart)
	_ObjectCallMethod(g2antt, "ExecuteTemplate", "chaObj.PaneWidth(False) = 48");
	_ObjectSetProperty( chart , "FirstVisibleDate", "12/28/2000");
	_ObjectSetProperty( chart , "LevelCount", 2);
	bar = _ObjectCallMethod(g2antt, "ExecuteTemplate", "chaObj.Bars.Item(`Task`)");
		_ObjectSetProperty( bar , "OverlaidGroup", "OTask");
		_ObjectSetProperty( bar , "OverlaidType", 0);
		_ObjectCallMethod(g2antt, "TemplatePut", "Dim barObj")
		_ObjectCallMethod(g2antt, "TemplatePut", bar)
		_ObjectCallMethod(g2antt, "ExecuteTemplate", "barObj.Def(3) = `<%=%9%>`");
	bar = _ObjectCallMethod( _ObjectGetProperty( chart , "Bars") , "Copy", "Task","OTask");
		_ObjectSetProperty( bar , "OverlaidGroup", "Task");
		_ObjectSetProperty( bar , "OverlaidType", 8196);
items = _ObjectGetProperty( g2antt , "Items");
	h1 = _ObjectCallMethod( items , "AddItem", "Default");
	h = _ObjectCallMethod( items , "AddItem", "Overlaid");
	_ObjectCallMethod( items , "AddBar", h,"Task","1/2/2001","1/4/2001","A1");
	_ObjectCallMethod( items , "AddBar", h,"Task","1/4/2001","1/7/2001","A3");
	_ObjectCallMethod( items , "AddBar", h,"OTask","1/3/2001","1/5/2001","A2");
	_ObjectCallMethod(g2antt, "TemplatePut", "Dim iteObj,h")
	_ObjectCallMethod(g2antt, "TemplatePut", items)
	_ObjectCallMethod(g2antt, "TemplatePut", h)
	_ObjectCallMethod(g2antt, "ExecuteTemplate", "iteObj.ItemBar(h,`A2`,33) = 255");
	_ObjectCallMethod( items , "AddBar", h,"Task","1/5/2001","1/8/2001","A4");
	h1 = _ObjectCallMethod( items , "AddItem", "Default");
_ObjectCallMethod( g2antt , "EndUpdate");
|
|
1424
|
How can I use the exOverlaidBarsCascade, exBarOverlaidKey
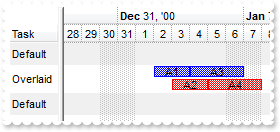
// CreateBar event - Fired when the user creates a new bar.
FUNCTION g2anttEvents_CreateBar(OBJECT g2antt, INT Item, REAL DateStart, REAL DateEnd)
	_ObjectCallMethod(g2antt, "TemplatePut", "Dim Item")
	_ObjectCallMethod(g2antt, "TemplatePut", Item)
	_ObjectCallMethod(g2antt, "ExecuteTemplate", "Items.ItemBar(Item,`newbar`,52) = `Level0`");
END

OBJECT bar,chart,g2antt,items;

g2antt =  ObjectByName("AN1") ;
ObjectAssociateEvents("g2anttEvents", g2antt);
_ObjectCallMethod( g2antt , "BeginUpdate");
_ObjectSetProperty( g2antt , "DefaultItemHeight", 22);
_ObjectCallMethod( _ObjectGetProperty( g2antt , "Columns") , "Add", "Task");
_ObjectSetProperty( g2antt , "ScrollBySingleLine", -1);
_ObjectSetProperty( g2antt , "BackColorAlternate", 15790320);
chart = _ObjectGetProperty( g2antt , "Chart");
	_ObjectSetProperty( chart , "AllowCreateBar", 1);
	_ObjectCallMethod(g2antt, "TemplatePut", "Dim chaObj")
	_ObjectCallMethod(g2antt, "TemplatePut", chart)
	_ObjectCallMethod(g2antt, "ExecuteTemplate", "chaObj.PaneWidth(False) = 48");
	_ObjectSetProperty( chart , "FirstVisibleDate", "12/28/2000");
	_ObjectSetProperty( chart , "LevelCount", 2);
	bar = _ObjectCallMethod(g2antt, "ExecuteTemplate", "chaObj.Bars.Item(`Task`)");
		_ObjectSetProperty( bar , "OverlaidType", 4);
		_ObjectCallMethod(g2antt, "TemplatePut", "Dim barObj")
		_ObjectCallMethod(g2antt, "TemplatePut", bar)
		_ObjectCallMethod(g2antt, "ExecuteTemplate", "barObj.Def(3) = `<%=%9%>`");
items = _ObjectGetProperty( g2antt , "Items");
	h1 = _ObjectCallMethod( items , "AddItem", "Default");
	h = _ObjectCallMethod( items , "AddItem", "Overlaid");
	_ObjectCallMethod( items , "AddBar", h,"Task","1/2/2001","1/4/2001","A1");
	_ObjectCallMethod(g2antt, "TemplatePut", "Dim iteObj,h")
	_ObjectCallMethod(g2antt, "TemplatePut", items)
	_ObjectCallMethod(g2antt, "TemplatePut", h)
	_ObjectCallMethod(g2antt, "ExecuteTemplate", "iteObj.ItemBar(h,`A1`,52) = `Level0`");
	_ObjectCallMethod( items , "AddBar", h,"Task","1/4/2001","1/7/2001","A3");
	_ObjectCallMethod(g2antt, "ExecuteTemplate", "iteObj.ItemBar(h,`A3`,52) = `Level0`");
	_ObjectCallMethod( items , "AddBar", h,"Task","1/3/2001","1/5/2001","A2");
	_ObjectCallMethod(g2antt, "ExecuteTemplate", "iteObj.ItemBar(h,`A2`,33) = 255");
	_ObjectCallMethod(g2antt, "ExecuteTemplate", "iteObj.ItemBar(h,`A2`,52) = `Level1`");
	_ObjectCallMethod( items , "AddBar", h,"Task","1/5/2001","1/8/2001","A4");
	_ObjectCallMethod(g2antt, "ExecuteTemplate", "iteObj.ItemBar(h,`A4`,33) = 255");
	_ObjectCallMethod(g2antt, "ExecuteTemplate", "iteObj.ItemBar(h,`A4`,52) = `Level1`");
	h1 = _ObjectCallMethod( items , "AddItem", "Default");
_ObjectCallMethod( g2antt , "EndUpdate");
|
|
1423
|
How can I use the exOverlaidBarsStack+exOverlaidBarsStackAutoArrange
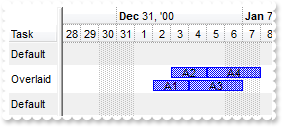
OBJECT bar,chart,g2antt,items;

g2antt =  ObjectByName("AN1") ;
_ObjectCallMethod( g2antt , "BeginUpdate");
_ObjectSetProperty( g2antt , "DefaultItemHeight", 22);
_ObjectCallMethod( _ObjectGetProperty( g2antt , "Columns") , "Add", "Task");
_ObjectSetProperty( g2antt , "ScrollBySingleLine", -1);
_ObjectSetProperty( g2antt , "BackColorAlternate", 15790320);
chart = _ObjectGetProperty( g2antt , "Chart");
	_ObjectCallMethod(g2antt, "TemplatePut", "Dim chaObj")
	_ObjectCallMethod(g2antt, "TemplatePut", chart)
	_ObjectCallMethod(g2antt, "ExecuteTemplate", "chaObj.PaneWidth(False) = 48");
	_ObjectSetProperty( chart , "FirstVisibleDate", "12/28/2000");
	_ObjectSetProperty( chart , "LevelCount", 2);
	bar = _ObjectCallMethod(g2antt, "ExecuteTemplate", "chaObj.Bars.Item(`Task`)");
		_ObjectSetProperty( bar , "OverlaidType", 515);
		_ObjectCallMethod(g2antt, "TemplatePut", "Dim barObj")
		_ObjectCallMethod(g2antt, "TemplatePut", bar)
		_ObjectCallMethod(g2antt, "ExecuteTemplate", "barObj.Def(3) = `<%=%9%>`");
items = _ObjectGetProperty( g2antt , "Items");
	h1 = _ObjectCallMethod( items , "AddItem", "Default");
	h = _ObjectCallMethod( items , "AddItem", "Overlaid");
	_ObjectCallMethod( items , "AddBar", h,"Task","1/2/2001","1/4/2001","A1");
	_ObjectCallMethod( items , "AddBar", h,"Task","1/3/2001","1/5/2001","A2");
	_ObjectCallMethod( items , "AddBar", h,"Task","1/4/2001","1/7/2001","A3");
	_ObjectCallMethod( items , "AddBar", h,"Task","1/5/2001","1/8/2001","A4");
	h1 = _ObjectCallMethod( items , "AddItem", "Default");
_ObjectCallMethod( g2antt , "EndUpdate");
|
|
1422
|
How can I use the exOverlaidBarsStack
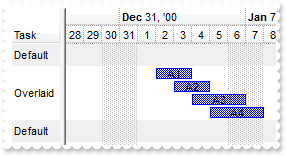
OBJECT bar,chart,g2antt,items;

g2antt =  ObjectByName("AN1") ;
_ObjectCallMethod( g2antt , "BeginUpdate");
_ObjectSetProperty( g2antt , "DefaultItemHeight", 22);
_ObjectCallMethod( _ObjectGetProperty( g2antt , "Columns") , "Add", "Task");
_ObjectSetProperty( g2antt , "ScrollBySingleLine", -1);
_ObjectSetProperty( g2antt , "BackColorAlternate", 15790320);
chart = _ObjectGetProperty( g2antt , "Chart");
	_ObjectCallMethod(g2antt, "TemplatePut", "Dim chaObj")
	_ObjectCallMethod(g2antt, "TemplatePut", chart)
	_ObjectCallMethod(g2antt, "ExecuteTemplate", "chaObj.PaneWidth(False) = 48");
	_ObjectSetProperty( chart , "FirstVisibleDate", "12/28/2000");
	_ObjectSetProperty( chart , "LevelCount", 2);
	bar = _ObjectCallMethod(g2antt, "ExecuteTemplate", "chaObj.Bars.Item(`Task`)");
		_ObjectSetProperty( bar , "OverlaidType", 3);
		_ObjectCallMethod(g2antt, "TemplatePut", "Dim barObj")
		_ObjectCallMethod(g2antt, "TemplatePut", bar)
		_ObjectCallMethod(g2antt, "ExecuteTemplate", "barObj.Def(3) = `<%=%9%>`");
items = _ObjectGetProperty( g2antt , "Items");
	h1 = _ObjectCallMethod( items , "AddItem", "Default");
	h = _ObjectCallMethod( items , "AddItem", "Overlaid");
	_ObjectCallMethod( items , "AddBar", h,"Task","1/2/2001","1/4/2001","A1");
	_ObjectCallMethod( items , "AddBar", h,"Task","1/3/2001","1/5/2001","A2");
	_ObjectCallMethod( items , "AddBar", h,"Task","1/4/2001","1/7/2001","A3");
	_ObjectCallMethod( items , "AddBar", h,"Task","1/5/2001","1/8/2001","A4");
	h1 = _ObjectCallMethod( items , "AddItem", "Default");
_ObjectCallMethod( g2antt , "EndUpdate");
|
|
1421
|
How can I use the exOverlaidBarsIntersect
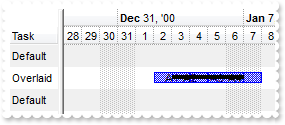
OBJECT bar,chart,g2antt,items;

g2antt =  ObjectByName("AN1") ;
_ObjectCallMethod( g2antt , "BeginUpdate");
_ObjectSetProperty( g2antt , "DefaultItemHeight", 22);
_ObjectCallMethod( _ObjectGetProperty( g2antt , "Columns") , "Add", "Task");
_ObjectSetProperty( g2antt , "ScrollBySingleLine", -1);
_ObjectSetProperty( g2antt , "BackColorAlternate", 15790320);
chart = _ObjectGetProperty( g2antt , "Chart");
	_ObjectCallMethod(g2antt, "TemplatePut", "Dim chaObj")
	_ObjectCallMethod(g2antt, "TemplatePut", chart)
	_ObjectCallMethod(g2antt, "ExecuteTemplate", "chaObj.PaneWidth(False) = 48");
	_ObjectSetProperty( chart , "FirstVisibleDate", "12/28/2000");
	_ObjectSetProperty( chart , "LevelCount", 2);
	bar = _ObjectCallMethod(g2antt, "ExecuteTemplate", "chaObj.Bars.Item(`Task`)");
		_ObjectSetProperty( bar , "OverlaidType", 2);
		_ObjectCallMethod(g2antt, "TemplatePut", "Dim barObj")
		_ObjectCallMethod(g2antt, "TemplatePut", bar)
		_ObjectCallMethod(g2antt, "ExecuteTemplate", "barObj.Overlaid(2) = `Progress`");
		_ObjectCallMethod(g2antt, "ExecuteTemplate", "barObj.Def(3) = `<%=%9%>`");
items = _ObjectGetProperty( g2antt , "Items");
	h1 = _ObjectCallMethod( items , "AddItem", "Default");
	h = _ObjectCallMethod( items , "AddItem", "Overlaid");
	_ObjectCallMethod( items , "AddBar", h,"Task","1/2/2001","1/4/2001","A1");
	_ObjectCallMethod( items , "AddBar", h,"Task","1/3/2001","1/5/2001","A2");
	_ObjectCallMethod( items , "AddBar", h,"Task","1/4/2001","1/7/2001","A3");
	_ObjectCallMethod( items , "AddBar", h,"Task","1/5/2001","1/8/2001","A4");
	h1 = _ObjectCallMethod( items , "AddItem", "Default");
_ObjectCallMethod( g2antt , "EndUpdate");
|
|
1420
|
How can I use the exOverlaidBarsOffset
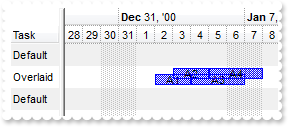
OBJECT bar,chart,g2antt,items;

g2antt =  ObjectByName("AN1") ;
_ObjectCallMethod( g2antt , "BeginUpdate");
_ObjectSetProperty( g2antt , "DefaultItemHeight", 22);
_ObjectCallMethod( _ObjectGetProperty( g2antt , "Columns") , "Add", "Task");
_ObjectSetProperty( g2antt , "ScrollBySingleLine", -1);
_ObjectSetProperty( g2antt , "BackColorAlternate", 15790320);
chart = _ObjectGetProperty( g2antt , "Chart");
	_ObjectCallMethod(g2antt, "TemplatePut", "Dim chaObj")
	_ObjectCallMethod(g2antt, "TemplatePut", chart)
	_ObjectCallMethod(g2antt, "ExecuteTemplate", "chaObj.PaneWidth(False) = 48");
	_ObjectSetProperty( chart , "FirstVisibleDate", "12/28/2000");
	_ObjectSetProperty( chart , "LevelCount", 2);
	bar = _ObjectCallMethod(g2antt, "ExecuteTemplate", "chaObj.Bars.Item(`Task`)");
		_ObjectSetProperty( bar , "OverlaidType", 1);
		_ObjectCallMethod(g2antt, "TemplatePut", "Dim barObj")
		_ObjectCallMethod(g2antt, "TemplatePut", bar)
		_ObjectCallMethod(g2antt, "ExecuteTemplate", "barObj.Def(3) = `<%=%9%>`");
items = _ObjectGetProperty( g2antt , "Items");
	h1 = _ObjectCallMethod( items , "AddItem", "Default");
	h = _ObjectCallMethod( items , "AddItem", "Overlaid");
	_ObjectCallMethod( items , "AddBar", h,"Task","1/2/2001","1/4/2001","A1");
	_ObjectCallMethod( items , "AddBar", h,"Task","1/3/2001","1/5/2001","A2");
	_ObjectCallMethod( items , "AddBar", h,"Task","1/4/2001","1/7/2001","A3");
	_ObjectCallMethod( items , "AddBar", h,"Task","1/5/2001","1/8/2001","A4");
	h1 = _ObjectCallMethod( items , "AddItem", "Default");
_ObjectCallMethod( g2antt , "EndUpdate");
|
|
1419
|
Is it possible to specify the end of the project when using the SchedulePDM method
OBJECT chart,g2antt,items;

g2antt =  ObjectByName("AN1") ;
_ObjectCallMethod( g2antt , "BeginUpdate");
_ObjectCallMethod( _ObjectGetProperty( g2antt , "Columns") , "Add", "Task");
chart = _ObjectGetProperty( g2antt , "Chart");
	_ObjectSetProperty( chart , "FirstVisibleDate", "12/28/2000");
	_ObjectCallMethod(g2antt, "TemplatePut", "Dim chaObj")
	_ObjectCallMethod(g2antt, "TemplatePut", chart)
	_ObjectCallMethod(g2antt, "ExecuteTemplate", "chaObj.PaneWidth(False) = 48");
	_ObjectSetProperty( chart , "LevelCount", 2);
items = _ObjectGetProperty( g2antt , "Items");
	h1 = _ObjectCallMethod( items , "AddItem", "Task 1");
	_ObjectCallMethod( items , "AddBar", h1,"Task","1/2/2001","1/4/2001","K1");
	h2 = _ObjectCallMethod( items , "AddItem", "Task 2");
	_ObjectCallMethod( items , "AddBar", h2,"Task","1/2/2001","1/5/2001","K2");
	_ObjectCallMethod( items , "AddLink", "L1",h1,"K1",h2,"K2");
	_ObjectCallMethod(g2antt, "TemplatePut", "Dim iteObj")
	_ObjectCallMethod(g2antt, "TemplatePut", items)
	_ObjectCallMethod(g2antt, "ExecuteTemplate", "iteObj.Link(`L1`,12) = `FS`");
	h3 = _ObjectCallMethod( items , "AddItem", "Task 3");
	_ObjectCallMethod( items , "AddBar", h3,"Task","1/2/2001","1/6/2001","K3");
	_ObjectCallMethod( items , "AddLink", "L2",h2,"K2",h3,"K3");
	_ObjectCallMethod(g2antt, "ExecuteTemplate", "iteObj.Link(`L2`,12) = `SS`");
	_ObjectCallMethod(g2antt, "ExecuteTemplate", "iteObj.Link(`L2`,6) = 0");
	_ObjectCallMethod(g2antt, "ExecuteTemplate", "iteObj.Link(`L2`,7) = 0");
	_ObjectCallMethod(g2antt, "ExecuteTemplate", "iteObj.DefSchedulePDM(0) = 2");
	_ObjectCallMethod(g2antt, "ExecuteTemplate", "iteObj.DefSchedulePDM(1) = #1/8/2001#");
	_ObjectCallMethod( items , "SchedulePDM", 0,"K1");
_ObjectCallMethod( g2antt , "EndUpdate");
|
|
1418
|
Is it possible to specify the start of the project when using the SchedulePDM method
OBJECT chart,g2antt,items;

g2antt =  ObjectByName("AN1") ;
_ObjectCallMethod( g2antt , "BeginUpdate");
_ObjectCallMethod( _ObjectGetProperty( g2antt , "Columns") , "Add", "Task");
chart = _ObjectGetProperty( g2antt , "Chart");
	_ObjectSetProperty( chart , "FirstVisibleDate", "12/28/2000");
	_ObjectCallMethod(g2antt, "TemplatePut", "Dim chaObj")
	_ObjectCallMethod(g2antt, "TemplatePut", chart)
	_ObjectCallMethod(g2antt, "ExecuteTemplate", "chaObj.PaneWidth(False) = 48");
	_ObjectSetProperty( chart , "LevelCount", 2);
items = _ObjectGetProperty( g2antt , "Items");
	h1 = _ObjectCallMethod( items , "AddItem", "Task 1");
	_ObjectCallMethod( items , "AddBar", h1,"Task","1/2/2001","1/4/2001","K1");
	h2 = _ObjectCallMethod( items , "AddItem", "Task 2");
	_ObjectCallMethod( items , "AddBar", h2,"Task","1/2/2001","1/5/2001","K2");
	_ObjectCallMethod( items , "AddLink", "L1",h1,"K1",h2,"K2");
	_ObjectCallMethod(g2antt, "TemplatePut", "Dim iteObj")
	_ObjectCallMethod(g2antt, "TemplatePut", items)
	_ObjectCallMethod(g2antt, "ExecuteTemplate", "iteObj.Link(`L1`,12) = `FS`");
	h3 = _ObjectCallMethod( items , "AddItem", "Task 3");
	_ObjectCallMethod( items , "AddBar", h3,"Task","1/2/2001","1/6/2001","K3");
	_ObjectCallMethod( items , "AddLink", "L2",h2,"K2",h3,"K3");
	_ObjectCallMethod(g2antt, "ExecuteTemplate", "iteObj.Link(`L2`,12) = `SS`");
	_ObjectCallMethod(g2antt, "ExecuteTemplate", "iteObj.Link(`L2`,6) = 0");
	_ObjectCallMethod(g2antt, "ExecuteTemplate", "iteObj.Link(`L2`,7) = 0");
	_ObjectCallMethod(g2antt, "ExecuteTemplate", "iteObj.DefSchedulePDM(0) = 1");
	_ObjectCallMethod(g2antt, "ExecuteTemplate", "iteObj.DefSchedulePDM(1) = #1/8/2001#");
	_ObjectCallMethod( items , "SchedulePDM", 0,"K1");
_ObjectCallMethod( g2antt , "EndUpdate");
|
|
1417
|
How can I change the caption or the addition information being displayed in the Zoom-OnFly view
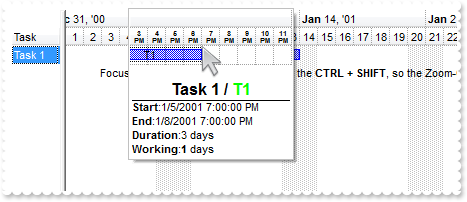
OBJECT chart,g2antt,items;

g2antt =  ObjectByName("AN1") ;
_ObjectCallMethod( g2antt , "BeginUpdate");
_ObjectCallMethod( _ObjectGetProperty( g2antt , "Columns") , "Add", "Task");
chart = _ObjectGetProperty( g2antt , "Chart");
	_ObjectCallMethod(g2antt, "TemplatePut", "Dim chaObj")
	_ObjectCallMethod(g2antt, "TemplatePut", chart)
	_ObjectCallMethod(g2antt, "ExecuteTemplate", "chaObj.PaneWidth(False) = 48");
	_ObjectSetProperty( chart , "FirstVisibleDate", "1/1/2001");
	_ObjectSetProperty( chart , "LevelCount", 2);
	_ObjectSetProperty( chart , "AllowZoomOnFly", 24);
	_ObjectSetProperty( chart , "ResizeUnitScale", 65536);
	_ObjectCallMethod(g2antt, "ExecuteTemplate", "chaObj.Label(65536) = `<font ;5><b><%h%><br><%AM/PM%></b></font>`");
	_ObjectSetProperty( chart , "ZoomOnFlyCaption", "<br><c><b><font ;12><%=%C0 + ' / <fgcolor=00FF00>' + %3%></font></fgcolor></b><br><solidline><upline><b>Start</b>:<%=%1%><br><b" +
	">End</b>:<%=%2%><br><b>Duration</b>:<%=round(%2-%1) + ' days'%><br><b>Working</b>:<%='<b>' + int(%258) + '</b> days' + (0:=(%258" +
	" - int(%258)) ? (' <fgcolor=FF0000><b>' + round(24 * =:0) + '</b> hours') : '') %>");
items = _ObjectGetProperty( g2antt , "Items");
	h = _ObjectCallMethod( items , "AddItem", "Task 1");
	_ObjectCallMethod( items , "AddBar", h,"Task","1/7/2001","1/10/2001","T1","T1");
	_ObjectCallMethod( items , "AddBar", h,"Task","1/11/2001","1/14/2001","T3","T3");
	h = _ObjectCallMethod( items , "AddItem", );
	_ObjectCallMethod( items , "AddBar", h,"","1/15/2001","1/15/2001","","Focus the chart ( click here ), and press the <b>CTRL + SHIFT</b>, so the Zoom-OnFly is shown.");
	_ObjectCallMethod(g2antt, "TemplatePut", "Dim iteObj,h")
	_ObjectCallMethod(g2antt, "TemplatePut", items)
	_ObjectCallMethod(g2antt, "TemplatePut", h)
	_ObjectCallMethod(g2antt, "ExecuteTemplate", "iteObj.SelectableItem(h) = False");
_ObjectCallMethod( g2antt , "EndUpdate");
|
|
1416
|
How can I change the scale in the Zoom-OnFly view
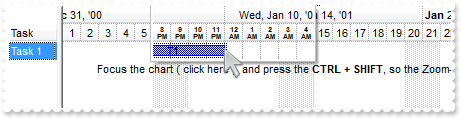
OBJECT chart,g2antt,items;

g2antt =  ObjectByName("AN1") ;
_ObjectCallMethod( g2antt , "BeginUpdate");
_ObjectCallMethod( _ObjectGetProperty( g2antt , "Columns") , "Add", "Task");
chart = _ObjectGetProperty( g2antt , "Chart");
	_ObjectCallMethod(g2antt, "TemplatePut", "Dim chaObj")
	_ObjectCallMethod(g2antt, "TemplatePut", chart)
	_ObjectCallMethod(g2antt, "ExecuteTemplate", "chaObj.PaneWidth(False) = 48");
	_ObjectSetProperty( chart , "FirstVisibleDate", "1/1/2001");
	_ObjectSetProperty( chart , "LevelCount", 2);
	_ObjectSetProperty( chart , "AllowZoomOnFly", 24);
	_ObjectSetProperty( chart , "ResizeUnitScale", 65536);
	_ObjectCallMethod(g2antt, "ExecuteTemplate", "chaObj.Label(65536) = `<font ;5><b><%h%><br><%AM/PM%></b></font>`");
	_ObjectSetProperty( chart , "ZoomOnFlyCaption", "");
items = _ObjectGetProperty( g2antt , "Items");
	h = _ObjectCallMethod( items , "AddItem", "Task 1");
	_ObjectCallMethod( items , "AddBar", h,"Task","1/7/2001","1/10/2001","T1","T1");
	_ObjectCallMethod( items , "AddBar", h,"Task","1/11/2001","1/14/2001","T3","T3");
	h = _ObjectCallMethod( items , "AddItem", );
	_ObjectCallMethod( items , "AddBar", h,"","1/15/2001","1/15/2001","","Focus the chart ( click here ), and press the <b>CTRL + SHIFT</b>, so the Zoom-OnFly is shown.");
	_ObjectCallMethod(g2antt, "TemplatePut", "Dim iteObj,h")
	_ObjectCallMethod(g2antt, "TemplatePut", items)
	_ObjectCallMethod(g2antt, "TemplatePut", h)
	_ObjectCallMethod(g2antt, "ExecuteTemplate", "iteObj.SelectableItem(h) = False");
_ObjectCallMethod( g2antt , "EndUpdate");
|
|
1415
|
Is it possible to change the Zoom-OnFly view's background color
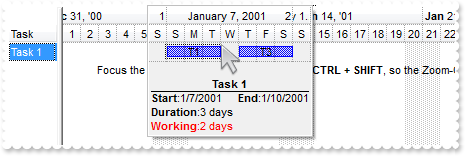
OBJECT chart,g2antt,items;

g2antt =  ObjectByName("AN1") ;
_ObjectCallMethod( g2antt , "BeginUpdate");
_ObjectCallMethod( _ObjectGetProperty( g2antt , "Columns") , "Add", "Task");
chart = _ObjectGetProperty( g2antt , "Chart");
	_ObjectCallMethod(g2antt, "TemplatePut", "Dim chaObj")
	_ObjectCallMethod(g2antt, "TemplatePut", chart)
	_ObjectCallMethod(g2antt, "ExecuteTemplate", "chaObj.PaneWidth(False) = 48");
	_ObjectSetProperty( chart , "FirstVisibleDate", "1/1/2001");
	_ObjectSetProperty( chart , "LevelCount", 2);
	_ObjectSetProperty( chart , "AllowZoomOnFly", 24);
	_ObjectSetProperty( chart , "BackColorZoomOnFly", 15790320);
items = _ObjectGetProperty( g2antt , "Items");
	h = _ObjectCallMethod( items , "AddItem", "Task 1");
	_ObjectCallMethod( items , "AddBar", h,"Task","1/7/2001","1/10/2001","T1","T1");
	_ObjectCallMethod( items , "AddBar", h,"Task","1/11/2001","1/14/2001","T3","T3");
	h = _ObjectCallMethod( items , "AddItem", );
	_ObjectCallMethod( items , "AddBar", h,"","1/15/2001","1/15/2001","","Focus the chart ( click here ), and press the <b>CTRL + SHIFT</b>, so the Zoom-OnFly is shown.");
	_ObjectCallMethod(g2antt, "TemplatePut", "Dim iteObj,h")
	_ObjectCallMethod(g2antt, "TemplatePut", items)
	_ObjectCallMethod(g2antt, "TemplatePut", h)
	_ObjectCallMethod(g2antt, "ExecuteTemplate", "iteObj.SelectableItem(h) = False");
_ObjectCallMethod( g2antt , "EndUpdate");
|
|
1414
|
How can I include the selected items in the Zoom-OnFly view
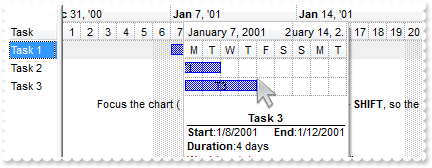
OBJECT chart,g2antt,items;

g2antt =  ObjectByName("AN1") ;
_ObjectCallMethod( g2antt , "BeginUpdate");
_ObjectCallMethod( _ObjectGetProperty( g2antt , "Columns") , "Add", "Task");
chart = _ObjectGetProperty( g2antt , "Chart");
	_ObjectCallMethod(g2antt, "TemplatePut", "Dim chaObj")
	_ObjectCallMethod(g2antt, "TemplatePut", chart)
	_ObjectCallMethod(g2antt, "ExecuteTemplate", "chaObj.PaneWidth(False) = 48");
	_ObjectSetProperty( chart , "FirstVisibleDate", "1/1/2001");
	_ObjectSetProperty( chart , "LevelCount", 2);
	_ObjectSetProperty( chart , "AllowZoomOnFly", 792);
	_ObjectSetProperty( chart , "SelBackColor", 15790320);
	_ObjectSetProperty( chart , "SelectOnClick", 0);
items = _ObjectGetProperty( g2antt , "Items");
	h = _ObjectCallMethod( items , "AddItem", "Task 1");
	_ObjectCallMethod( items , "AddBar", h,"Task","1/7/2001","1/10/2001","T1","T1");
	_ObjectCallMethod(g2antt, "TemplatePut", "Dim iteObj,h")
	_ObjectCallMethod(g2antt, "TemplatePut", items)
	_ObjectCallMethod(g2antt, "TemplatePut", h)
	_ObjectCallMethod(g2antt, "ExecuteTemplate", "iteObj.SelectItem(h) = True");
	h = _ObjectCallMethod( items , "AddItem", "Task 2");
	_ObjectCallMethod( items , "AddBar", h,"Task","1/11/2001","1/14/2001","T2","T2");
	h = _ObjectCallMethod( items , "AddItem", "Task 3");
	_ObjectCallMethod( items , "AddBar", h,"Task","1/8/2001","1/12/2001","T3","T3");
	h = _ObjectCallMethod( items , "AddItem", );
	_ObjectCallMethod( items , "AddBar", h,"","1/15/2001","1/15/2001","","Focus the chart ( click here ), and press the <b>CTRL + SHIFT</b>, so the Zoom-OnFly is shown.");
	_ObjectCallMethod(g2antt, "ExecuteTemplate", "iteObj.SelectableItem(h) = False");
_ObjectCallMethod( g2antt , "EndUpdate");
|
|
1413
|
Is it possible to include the neighbors items in the Zoom-OnFly view
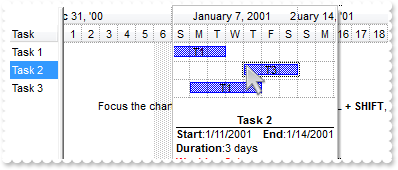
OBJECT chart,g2antt,items;

g2antt =  ObjectByName("AN1") ;
_ObjectCallMethod( g2antt , "BeginUpdate");
_ObjectCallMethod( _ObjectGetProperty( g2antt , "Columns") , "Add", "Task");
chart = _ObjectGetProperty( g2antt , "Chart");
	_ObjectCallMethod(g2antt, "TemplatePut", "Dim chaObj")
	_ObjectCallMethod(g2antt, "TemplatePut", chart)
	_ObjectCallMethod(g2antt, "ExecuteTemplate", "chaObj.PaneWidth(False) = 48");
	_ObjectSetProperty( chart , "FirstVisibleDate", "1/1/2001");
	_ObjectSetProperty( chart , "LevelCount", 2);
	_ObjectSetProperty( chart , "AllowZoomOnFly", 280);
items = _ObjectGetProperty( g2antt , "Items");
	h = _ObjectCallMethod( items , "AddItem", "Task 1");
	_ObjectCallMethod( items , "AddBar", h,"Task","1/7/2001","1/10/2001","T1","T1");
	h = _ObjectCallMethod( items , "AddItem", "Task 2");
	_ObjectCallMethod( items , "AddBar", h,"Task","1/11/2001","1/14/2001","T3","T3");
	h = _ObjectCallMethod( items , "AddItem", "Task 3");
	_ObjectCallMethod( items , "AddBar", h,"Task","1/8/2001","1/12/2001","T1","T1");
	h = _ObjectCallMethod( items , "AddItem", );
	_ObjectCallMethod( items , "AddBar", h,"","1/15/2001","1/15/2001","","Focus the chart ( click here ), and press the <b>CTRL + SHIFT</b>, so the Zoom-OnFly is shown.");
	_ObjectCallMethod(g2antt, "TemplatePut", "Dim iteObj,h")
	_ObjectCallMethod(g2antt, "TemplatePut", items)
	_ObjectCallMethod(g2antt, "TemplatePut", h)
	_ObjectCallMethod(g2antt, "ExecuteTemplate", "iteObj.SelectableItem(h) = False");
_ObjectCallMethod( g2antt , "EndUpdate");
|
|
1412
|
How can I enable the Zoom-OnFly view
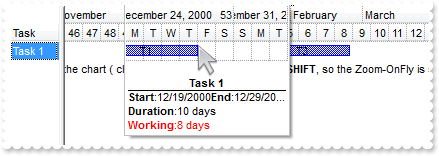
OBJECT chart,g2antt,items;

g2antt =  ObjectByName("AN1") ;
_ObjectCallMethod( g2antt , "BeginUpdate");
_ObjectCallMethod( _ObjectGetProperty( g2antt , "Columns") , "Add", "Task");
chart = _ObjectGetProperty( g2antt , "Chart");
	_ObjectCallMethod(g2antt, "TemplatePut", "Dim chaObj")
	_ObjectCallMethod(g2antt, "TemplatePut", chart)
	_ObjectCallMethod(g2antt, "ExecuteTemplate", "chaObj.PaneWidth(False) = 48");
	_ObjectSetProperty( chart , "FirstVisibleDate", "11/5/2000");
	_ObjectSetProperty( chart , "LevelCount", 2);
	_ObjectSetProperty( chart , "UnitScale", 256);
	_ObjectSetProperty( chart , "ResizeUnitScale", 4096);
	_ObjectSetProperty( chart , "AllowZoomOnFly", 24);
	_ObjectCallMethod(g2antt, "ExecuteTemplate", "chaObj.Bars.Item(`Task`).OverlaidType = 3");
items = _ObjectGetProperty( g2antt , "Items");
	h = _ObjectCallMethod( items , "AddItem", "Task 1");
	_ObjectCallMethod( items , "AddBar", h,"Task","1/7/2001","1/17/2001","T1","T1");
	_ObjectCallMethod( items , "AddBar", h,"Task","1/18/2001","2/24/2001","T3","T3");
	h = _ObjectCallMethod( items , "AddItem", );
	_ObjectCallMethod( items , "AddBar", h,"","1/15/2001","1/15/2001","","Focus the chart ( click here ), and press the <b>CTRL + SHIFT</b>, so the Zoom-OnFly is shown.");
	_ObjectCallMethod(g2antt, "TemplatePut", "Dim iteObj,h")
	_ObjectCallMethod(g2antt, "TemplatePut", items)
	_ObjectCallMethod(g2antt, "TemplatePut", h)
	_ObjectCallMethod(g2antt, "ExecuteTemplate", "iteObj.SelectableItem(h) = False");
_ObjectCallMethod( g2antt , "EndUpdate");
|
|
1411
|
I am using the overlay bars on stack, can I somehow tell a type of bar, or a specific bar, to be always on top of all other�s. Like a Z-Index or something
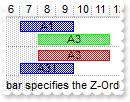
OBJECT chart,g2antt,items;

g2antt =  ObjectByName("AN1") ;
_ObjectCallMethod( g2antt , "BeginUpdate");
_ObjectSetProperty( g2antt , "ScrollBySingleLine", -1);
_ObjectCallMethod( _ObjectGetProperty( g2antt , "Columns") , "Add", "Task");
_ObjectSetProperty( g2antt , "DrawGridLines", 1);
chart = _ObjectGetProperty( g2antt , "Chart");
	_ObjectSetProperty( chart , "DrawGridLines", 1);
	_ObjectSetProperty( chart , "AllowCreateBar", 1);
	_ObjectSetProperty( chart , "AllowLinkBars", 0);
	_ObjectSetProperty( chart , "ResizeUnitScale", 65536);
	_ObjectCallMethod(g2antt, "TemplatePut", "Dim chaObj")
	_ObjectCallMethod(g2antt, "TemplatePut", chart)
	_ObjectCallMethod(g2antt, "ExecuteTemplate", "chaObj.PaneWidth(False) = 48");
	_ObjectSetProperty( chart , "FirstVisibleDate", "1/1/2001");
	_ObjectCallMethod(g2antt, "ExecuteTemplate", "chaObj.Bars.Item(`Task`).OverlaidType = 3");
items = _ObjectGetProperty( g2antt , "Items");
	h = _ObjectCallMethod( items , "AddItem", "Task 1");
	_ObjectCallMethod( items , "AddBar", h,"Task","1/7/2001","1/10/2001","A1","A1");
	_ObjectCallMethod( items , "AddBar", h,"Task","1/8/2001","1/12/2001","A3","A3");
	_ObjectCallMethod(g2antt, "TemplatePut", "Dim iteObj,h")
	_ObjectCallMethod(g2antt, "TemplatePut", items)
	_ObjectCallMethod(g2antt, "TemplatePut", h)
	_ObjectCallMethod(g2antt, "ExecuteTemplate", "iteObj.ItemBar(h,`A3`,33) = 65280");
	h = _ObjectCallMethod( items , "AddItem", "Task 2");
	_ObjectCallMethod( items , "AddBar", h,"Task","1/7/2001","1/10/2001","A31","A31");
	_ObjectCallMethod( items , "AddBar", h,"Task","1/8/2001","1/12/2001","A3","A3");
	_ObjectCallMethod(g2antt, "ExecuteTemplate", "iteObj.ItemBar(h,`A3`,33) = 255");
	_ObjectCallMethod( items , "AddBar", _ObjectCallMethod( items , "AddItem", ),"","1/10/2001","1/10/2001","","The <b>Key</b> of the bar specifies the Z-Order when overlaying.");
_ObjectCallMethod( g2antt , "EndUpdate");
|
|
1410
|
Is it possible to specify the z-order when using the overlaying feature
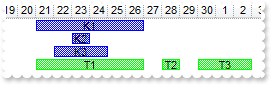
OBJECT chart,g2antt,items;

g2antt =  ObjectByName("AN1") ;
_ObjectCallMethod( g2antt , "BeginUpdate");
_ObjectCallMethod( _ObjectGetProperty( g2antt , "Columns") , "Add", "Tasks");
chart = _ObjectGetProperty( g2antt , "Chart");
	_ObjectSetProperty( chart , "NonworkingDays", 0);
	_ObjectSetProperty( chart , "FirstVisibleDate", "9/17/2006");
	_ObjectCallMethod(g2antt, "TemplatePut", "Dim chaObj")
	_ObjectCallMethod(g2antt, "TemplatePut", chart)
	_ObjectCallMethod(g2antt, "ExecuteTemplate", "chaObj.PaneWidth(False) = 64");
	_ObjectSetProperty( chart , "LevelCount", 2);
	_ObjectCallMethod(g2antt, "ExecuteTemplate", "chaObj.Bars.Item(`Task`).OverlaidType = 4");
items = _ObjectGetProperty( g2antt , "Items");
	h1 = _ObjectCallMethod( items , "AddItem", "Task");
	_ObjectCallMethod( items , "AddBar", h1,"Task","9/21/2006","9/27/2006","K1","K1");
	_ObjectCallMethod( items , "AddBar", h1,"Task","9/23/2006","9/24/2006","K2","K2");
	_ObjectCallMethod( items , "AddBar", h1,"Task","9/22/2006","9/25/2006","K3","K3");
	_ObjectCallMethod( items , "AddBar", h1,"Task","9/21/2006","9/27/2006","T1","T1");
	_ObjectCallMethod( items , "AddBar", h1,"Task","9/28/2006","9/29/2006","T2","T2");
	_ObjectCallMethod( items , "AddBar", h1,"Task","9/30/2006","10/3/2006","T3","T3");
	_ObjectCallMethod(g2antt, "TemplatePut", "Dim iteObj")
	_ObjectCallMethod(g2antt, "TemplatePut", items)
	_ObjectCallMethod(g2antt, "ExecuteTemplate", "iteObj.ItemBar(0,`<T*>`,33) = 65280");
	_ObjectCallMethod(g2antt, "ExecuteTemplate", "iteObj.ItemBar(0,`<K*>`,52) = `A`");
	_ObjectCallMethod(g2antt, "ExecuteTemplate", "iteObj.ItemBar(0,`<T*>`,52) = `B`");
_ObjectCallMethod( g2antt , "EndUpdate");
|
|
1409
|
I seen that there is no exBarStartColor, exBarEndColor, similar to exBarColor, is there any solution so I can display a different Start/End Color
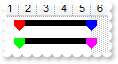
OBJECT bar,chart,g2antt,items;

g2antt =  ObjectByName("AN1") ;
_ObjectCallMethod( g2antt , "BeginUpdate");
chart = _ObjectGetProperty( g2antt , "Chart");
	_ObjectSetProperty( chart , "FirstVisibleDate", "1/1/2001");
	bar = _ObjectCallMethod( _ObjectGetProperty( chart , "Bars") , "Copy", "Summary","Aka1");
		_ObjectSetProperty( bar , "StartColor", 255);
		_ObjectSetProperty( bar , "EndColor", 16711680);
	bar = _ObjectCallMethod( _ObjectGetProperty( chart , "Bars") , "Copy", "Summary","Aka2");
		_ObjectSetProperty( bar , "StartColor", 65280);
		_ObjectSetProperty( bar , "EndColor", 16711935);
_ObjectCallMethod( _ObjectGetProperty( g2antt , "Columns") , "Add", "Column");
items = _ObjectGetProperty( g2antt , "Items");
	h = _ObjectCallMethod( items , "AddItem", "Item A");
	_ObjectCallMethod( items , "AddBar", h,"Task","1/2/2001","1/6/2001","B1");
	_ObjectCallMethod(g2antt, "TemplatePut", "Dim iteObj,h")
	_ObjectCallMethod(g2antt, "TemplatePut", items)
	_ObjectCallMethod(g2antt, "TemplatePut", h)
	_ObjectCallMethod(g2antt, "ExecuteTemplate", "iteObj.ItemBar(h,`B1`,0) = `Aka1`");
	h = _ObjectCallMethod( items , "AddItem", "Item B");
	_ObjectCallMethod( items , "AddBar", h,"Task","1/2/2001","1/6/2001","B2");
	_ObjectCallMethod(g2antt, "ExecuteTemplate", "iteObj.ItemBar(h,`B2`,0) = `Aka2`");
_ObjectCallMethod( g2antt , "EndUpdate");
|
|
1408
|
How can copy and paste the selection to Microsoft Word, any OLE compliant application, as a snapshot
OBJECT bar,chart,g2antt,items;

g2antt =  ObjectByName("AN1") ;
_ObjectCallMethod( g2antt , "BeginUpdate");
_ObjectCallMethod( _ObjectGetProperty( g2antt , "VisualAppearance") , "Add", 1,"c:\exontrol\images\normal.ebn");
_ObjectCallMethod(g2antt, "ExecuteTemplate", "HTMLPicture(`p1`) = `c:\exontrol\images\card.png`");
_ObjectCallMethod(g2antt, "ExecuteTemplate", "HTMLPicture(`p2`) = `c:\exontrol\images\sun.png`");
_ObjectSetProperty( g2antt , "AutoDrag", 11);
_ObjectSetProperty( g2antt , "LinesAtRoot", 0);
_ObjectSetProperty( g2antt , "HasLines", 2);
_ObjectSetProperty( g2antt , "ShowFocusRect", 0);
_ObjectSetProperty( g2antt , "DefaultItemHeight", 26);
_ObjectCallMethod( _ObjectGetProperty( g2antt , "Columns") , "Add", "Task");
chart = _ObjectGetProperty( g2antt , "Chart");
	_ObjectSetProperty( chart , "ShowNonworkingDates", 0);
	_ObjectSetProperty( chart , "FirstVisibleDate", "12/29/2000");
	_ObjectCallMethod(g2antt, "TemplatePut", "Dim chaObj")
	_ObjectCallMethod(g2antt, "TemplatePut", chart)
	_ObjectCallMethod(g2antt, "ExecuteTemplate", "chaObj.PaneWidth(False) = 96");
	_ObjectSetProperty( chart , "LevelCount", 2);
	bar = _ObjectCallMethod(g2antt, "ExecuteTemplate", "chaObj.Bars.Item(`Task`)");
		_ObjectSetProperty( bar , "Color", 16777216);
		_ObjectSetProperty( bar , "Height", 18);
items = _ObjectGetProperty( g2antt , "Items");
	h = _ObjectCallMethod( items , "AddItem", "<img>p1:32</img>Group 1");
	_ObjectCallMethod(g2antt, "TemplatePut", "Dim iteObj,h")
	_ObjectCallMethod(g2antt, "TemplatePut", items)
	_ObjectCallMethod(g2antt, "TemplatePut", h)
	_ObjectCallMethod(g2antt, "ExecuteTemplate", "iteObj.CellValueFormat(h,0) = 1");
	_ObjectCallMethod(g2antt, "ExecuteTemplate", "iteObj.ItemDivider(h) = 0");
	_ObjectCallMethod(g2antt, "ExecuteTemplate", "iteObj.ItemBold(h) = True");
	h1 = _ObjectCallMethod( items , "InsertItem", h,"","Task 1");
	_ObjectCallMethod( items , "AddBar", h1,"Task","1/2/2001","1/4/2001","K1");
	h2 = _ObjectCallMethod( items , "InsertItem", h,"","Task 2");
	_ObjectCallMethod( items , "AddBar", h2,"Task","1/5/2001","1/7/2001","K2");
	_ObjectCallMethod( items , "AddLink", "L1",h1,"K1",h2,"K2");
	_ObjectCallMethod(g2antt, "TemplatePut", "Dim iteObj")
	_ObjectCallMethod(g2antt, "TemplatePut", items)
	_ObjectCallMethod(g2antt, "ExecuteTemplate", "iteObj.Link(`L1`,12) = `L1`");
	h3 = _ObjectCallMethod( items , "InsertItem", h,"","Task 3");
	_ObjectCallMethod( items , "AddBar", h3,"Task","1/8/2001","1/10/2001","K3");
	_ObjectCallMethod( items , "AddLink", "L2",h2,"K2",h3,"K3");
	_ObjectCallMethod(g2antt, "ExecuteTemplate", "iteObj.Link(`L2`,12) = `L2`");
	h = _ObjectCallMethod( items , "AddItem", "<img>p2:32</img>Group 2");
	_ObjectCallMethod(g2antt, "TemplatePut", "Dim iteObj,h")
	_ObjectCallMethod(g2antt, "TemplatePut", items)
	_ObjectCallMethod(g2antt, "TemplatePut", h)
	_ObjectCallMethod(g2antt, "ExecuteTemplate", "iteObj.CellValueFormat(h,0) = 1");
	_ObjectCallMethod(g2antt, "ExecuteTemplate", "iteObj.ItemBold(h) = True");
	_ObjectCallMethod(g2antt, "ExecuteTemplate", "iteObj.ItemDivider(h) = 0");
	h1 = _ObjectCallMethod( items , "InsertItem", h,"","Task");
	_ObjectCallMethod( items , "AddBar", h1,"Task","1/2/2001","1/4/2001","K1");
	_ObjectCallMethod(g2antt, "TemplatePut", "Dim iteObj")
	_ObjectCallMethod(g2antt, "TemplatePut", items)
	_ObjectCallMethod(g2antt, "ExecuteTemplate", "iteObj.ExpandItem(0) = True");
_ObjectCallMethod( g2antt , "EndUpdate");
|
|
1407
|
How can copy and paste the selection to Microsoft Word, any OLE compliant application, as a image
OBJECT g2antt,items,rs;

g2antt =  ObjectByName("AN1") ;
_ObjectCallMethod( g2antt , "BeginUpdate");
_ObjectCallMethod(g2antt, "ExecuteTemplate", "HTMLPicture(`p1`) = `c:\exontrol\images\card.png`");
_ObjectCallMethod(g2antt, "ExecuteTemplate", "HTMLPicture(`p2`) = `c:\exontrol\images\sun.png`");
_ObjectCallMethod(g2antt, "ExecuteTemplate", "Chart.PaneWidth(True) = 0");
var_HTMLPicture = _ObjectCallMethod(g2antt, "ExecuteTemplate", "HTMLPicture(`aka1`)");
_ObjectSetProperty( g2antt , "HeaderHeight", 24);
_ObjectSetProperty( g2antt , "DefaultItemHeight", 48);
_ObjectSetProperty( g2antt , "DrawGridLines", -2);
_ObjectSetProperty( g2antt , "GridLineColor", 15790320);
_ObjectSetProperty( g2antt , "SelBackMode", 1);
_ObjectSetProperty( g2antt , "ColumnAutoResize", 0);
_ObjectSetProperty( g2antt , "ContinueColumnScroll", 0);
rs = CreateObject("ADOR.Recordset");
	_ObjectCallMethod( rs , "Open", "Orders","Provider=Microsoft.ACE.OLEDB.12.0;Data Source=C:\Program Files\Exontrol\ExG2antt\Sample\Access\misc.accdb",3,3);
_ObjectSetProperty( g2antt , "DataSource", rs);
_ObjectCallMethod(g2antt, "ExecuteTemplate", "Columns.Item(0).Def(17) = 1");
_ObjectCallMethod(g2antt, "ExecuteTemplate", "Columns.Item(0).FormatColumn = `value + ` <img>p` + (1 + (value mod 3 ) ) + `</img>``");
_ObjectCallMethod(g2antt, "ExecuteTemplate", "Columns.Item(0).Width = 112");
_ObjectCallMethod(g2antt, "ExecuteTemplate", "Columns.Item(1).Def(0) = 1");
_ObjectCallMethod(g2antt, "ExecuteTemplate", "Columns.Item(2).LevelKey = `1`");
_ObjectCallMethod(g2antt, "ExecuteTemplate", "Columns.Item(3).LevelKey = `1`");
_ObjectCallMethod(g2antt, "ExecuteTemplate", "Columns.Item(4).LevelKey = `1`");
_ObjectSetProperty( g2antt , "AutoDrag", 10);
_ObjectSetProperty( g2antt , "SingleSel", 0);
items = _ObjectGetProperty( g2antt , "Items");
	_ObjectCallMethod(g2antt, "TemplatePut", "Dim iteObj")
	_ObjectCallMethod(g2antt, "TemplatePut", items)
	h = _ObjectCallMethod(g2antt, "ExecuteTemplate", "iteObj.ItemByIndex(1)");
	_ObjectCallMethod(g2antt, "TemplatePut", "Dim iteObj,h")
	_ObjectCallMethod(g2antt, "TemplatePut", items)
	_ObjectCallMethod(g2antt, "TemplatePut", h)
	_ObjectCallMethod(g2antt, "ExecuteTemplate", "iteObj.SelectItem(h) = True");
	_ObjectCallMethod(g2antt, "TemplatePut", "Dim iteObj")
	_ObjectCallMethod(g2antt, "TemplatePut", items)
	h = _ObjectCallMethod(g2antt, "ExecuteTemplate", "iteObj.ItemByIndex(2)");
	_ObjectCallMethod(g2antt, "TemplatePut", "Dim iteObj,h")
	_ObjectCallMethod(g2antt, "TemplatePut", items)
	_ObjectCallMethod(g2antt, "TemplatePut", h)
	_ObjectCallMethod(g2antt, "ExecuteTemplate", "iteObj.SelectItem(h) = True");
	_ObjectCallMethod(g2antt, "TemplatePut", "Dim iteObj")
	_ObjectCallMethod(g2antt, "TemplatePut", items)
	h = _ObjectCallMethod(g2antt, "ExecuteTemplate", "iteObj.ItemByIndex(3)");
	_ObjectCallMethod(g2antt, "TemplatePut", "Dim iteObj,h")
	_ObjectCallMethod(g2antt, "TemplatePut", items)
	_ObjectCallMethod(g2antt, "TemplatePut", h)
	_ObjectCallMethod(g2antt, "ExecuteTemplate", "iteObj.SelectItem(h) = True");
	_ObjectCallMethod(g2antt, "TemplatePut", "Dim iteObj")
	_ObjectCallMethod(g2antt, "TemplatePut", items)
	_ObjectCallMethod(g2antt, "ExecuteTemplate", "iteObj.LockedItemCount(2) = 1");
	h = _ObjectCallMethod(g2antt, "ExecuteTemplate", "iteObj.LockedItem(2,0)");
	_ObjectCallMethod(g2antt, "TemplatePut", "Dim iteObj,h")
	_ObjectCallMethod(g2antt, "TemplatePut", items)
	_ObjectCallMethod(g2antt, "TemplatePut", h)
	_ObjectCallMethod(g2antt, "ExecuteTemplate", "iteObj.CellValue(h,1) = `<font ;16>Click the selection and <b>wait to start dragging</b>, and then drop to Microsoft Word, ...`");
	_ObjectCallMethod(g2antt, "ExecuteTemplate", "iteObj.CellSingleLine(h,1) = False");
	_ObjectCallMethod(g2antt, "ExecuteTemplate", "iteObj.CellValueFormat(h,1) = 1");
	_ObjectCallMethod(g2antt, "ExecuteTemplate", "iteObj.CellHAlignment(h,1) = 1");
	_ObjectCallMethod(g2antt, "ExecuteTemplate", "iteObj.ItemDivider(h) = 1");
	_ObjectCallMethod(g2antt, "ExecuteTemplate", "iteObj.ItemDividerLineAlignment(h) = 2");
_ObjectCallMethod( g2antt , "EndUpdate");
|
|
1406
|
How can copy and paste the selection to Microsoft Word, Excel or any OLE compliant application, as a text
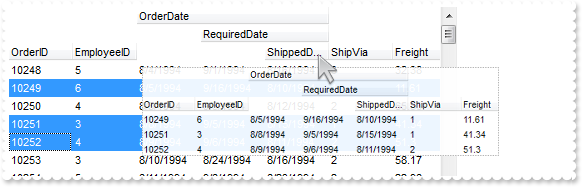
OBJECT g2antt,items,rs;

g2antt =  ObjectByName("AN1") ;
_ObjectCallMethod( g2antt , "BeginUpdate");
_ObjectCallMethod(g2antt, "ExecuteTemplate", "Chart.PaneWidth(True) = 0");
_ObjectSetProperty( g2antt , "ColumnAutoResize", 0);
_ObjectSetProperty( g2antt , "ContinueColumnScroll", 0);
rs = CreateObject("ADOR.Recordset");
	_ObjectCallMethod( rs , "Open", "Orders","Provider=Microsoft.ACE.OLEDB.12.0;Data Source=C:\Program Files\Exontrol\ExG2antt\Sample\Access\misc.accdb",3,3);
_ObjectSetProperty( g2antt , "DataSource", rs);
_ObjectCallMethod(g2antt, "ExecuteTemplate", "Columns.Item(2).LevelKey = `1`");
_ObjectCallMethod(g2antt, "ExecuteTemplate", "Columns.Item(3).LevelKey = `1`");
_ObjectCallMethod(g2antt, "ExecuteTemplate", "Columns.Item(4).LevelKey = `1`");
_ObjectSetProperty( g2antt , "AutoDrag", 9);
_ObjectSetProperty( g2antt , "SingleSel", 0);
items = _ObjectGetProperty( g2antt , "Items");
	_ObjectCallMethod(g2antt, "TemplatePut", "Dim iteObj")
	_ObjectCallMethod(g2antt, "TemplatePut", items)
	h = _ObjectCallMethod(g2antt, "ExecuteTemplate", "iteObj.ItemByIndex(1)");
	_ObjectCallMethod(g2antt, "TemplatePut", "Dim iteObj,h")
	_ObjectCallMethod(g2antt, "TemplatePut", items)
	_ObjectCallMethod(g2antt, "TemplatePut", h)
	_ObjectCallMethod(g2antt, "ExecuteTemplate", "iteObj.SelectItem(h) = True");
	_ObjectCallMethod(g2antt, "TemplatePut", "Dim iteObj")
	_ObjectCallMethod(g2antt, "TemplatePut", items)
	h = _ObjectCallMethod(g2antt, "ExecuteTemplate", "iteObj.ItemByIndex(3)");
	_ObjectCallMethod(g2antt, "TemplatePut", "Dim iteObj,h")
	_ObjectCallMethod(g2antt, "TemplatePut", items)
	_ObjectCallMethod(g2antt, "TemplatePut", h)
	_ObjectCallMethod(g2antt, "ExecuteTemplate", "iteObj.SelectItem(h) = True");
	_ObjectCallMethod(g2antt, "TemplatePut", "Dim iteObj")
	_ObjectCallMethod(g2antt, "TemplatePut", items)
	h = _ObjectCallMethod(g2antt, "ExecuteTemplate", "iteObj.ItemByIndex(4)");
	_ObjectCallMethod(g2antt, "TemplatePut", "Dim iteObj,h")
	_ObjectCallMethod(g2antt, "TemplatePut", items)
	_ObjectCallMethod(g2antt, "TemplatePut", h)
	_ObjectCallMethod(g2antt, "ExecuteTemplate", "iteObj.SelectItem(h) = True");
	_ObjectCallMethod(g2antt, "TemplatePut", "Dim iteObj")
	_ObjectCallMethod(g2antt, "TemplatePut", items)
	h = _ObjectCallMethod(g2antt, "ExecuteTemplate", "iteObj.ItemByIndex(5)");
	_ObjectCallMethod(g2antt, "TemplatePut", "Dim iteObj,h")
	_ObjectCallMethod(g2antt, "TemplatePut", items)
	_ObjectCallMethod(g2antt, "TemplatePut", h)
	_ObjectCallMethod(g2antt, "ExecuteTemplate", "iteObj.SelectItem(h) = True");
	_ObjectCallMethod(g2antt, "TemplatePut", "Dim iteObj")
	_ObjectCallMethod(g2antt, "TemplatePut", items)
	_ObjectCallMethod(g2antt, "ExecuteTemplate", "iteObj.LockedItemCount(2) = 1");
	h = _ObjectCallMethod(g2antt, "ExecuteTemplate", "iteObj.LockedItem(2,0)");
	_ObjectCallMethod(g2antt, "TemplatePut", "Dim iteObj,h")
	_ObjectCallMethod(g2antt, "TemplatePut", items)
	_ObjectCallMethod(g2antt, "TemplatePut", h)
	_ObjectCallMethod(g2antt, "ExecuteTemplate", "iteObj.CellValue(h,0) = `<font ;16>Click the selection and <b>wait to start dragging</b>, and then drop to Microsoft Word, Excel, ...`");
	_ObjectCallMethod(g2antt, "ExecuteTemplate", "iteObj.CellSingleLine(h,0) = False");
	_ObjectCallMethod(g2antt, "ExecuteTemplate", "iteObj.CellValueFormat(h,0) = 1");
	_ObjectCallMethod(g2antt, "ExecuteTemplate", "iteObj.CellHAlignment(h,0) = 1");
	_ObjectCallMethod(g2antt, "ExecuteTemplate", "iteObj.ItemDivider(h) = 0");
	_ObjectCallMethod(g2antt, "ExecuteTemplate", "iteObj.ItemDividerLineAlignment(h) = 2");
_ObjectCallMethod( g2antt , "EndUpdate");
|
|
1405
|
Is it possible to change the indentation during the drag and drop
OBJECT chart,g2antt,items;

g2antt =  ObjectByName("AN1") ;
_ObjectCallMethod( g2antt , "BeginUpdate");
_ObjectCallMethod( _ObjectGetProperty( g2antt , "VisualAppearance") , "Add", 1,"c:\exontrol\images\normal.ebn");
_ObjectSetProperty( g2antt , "AutoDrag", 3);
_ObjectSetProperty( g2antt , "LinesAtRoot", 0);
_ObjectSetProperty( g2antt , "HasLines", 1);
_ObjectSetProperty( g2antt , "HasButtons", 3);
_ObjectSetProperty( g2antt , "ShowFocusRect", 0);
_ObjectSetProperty( g2antt , "SelBackMode", 1);
_ObjectCallMethod( _ObjectGetProperty( g2antt , "Columns") , "Add", "Task");
chart = _ObjectGetProperty( g2antt , "Chart");
	_ObjectSetProperty( chart , "ShowNonworkingDates", 0);
	_ObjectSetProperty( chart , "FirstVisibleDate", "12/29/2000");
	_ObjectCallMethod(g2antt, "TemplatePut", "Dim chaObj")
	_ObjectCallMethod(g2antt, "TemplatePut", chart)
	_ObjectCallMethod(g2antt, "ExecuteTemplate", "chaObj.PaneWidth(False) = 128");
	_ObjectSetProperty( chart , "LevelCount", 2);
	_ObjectCallMethod(g2antt, "ExecuteTemplate", "chaObj.Bars.Item(`Task`).Color = 16777216");
items = _ObjectGetProperty( g2antt , "Items");
	h = _ObjectCallMethod( items , "AddItem", "Group 1");
	_ObjectCallMethod(g2antt, "TemplatePut", "Dim iteObj,h")
	_ObjectCallMethod(g2antt, "TemplatePut", items)
	_ObjectCallMethod(g2antt, "TemplatePut", h)
	_ObjectCallMethod(g2antt, "ExecuteTemplate", "iteObj.ItemBold(h) = True");
	_ObjectCallMethod(g2antt, "ExecuteTemplate", "iteObj.ItemDivider(h) = 0");
	h1 = _ObjectCallMethod( items , "InsertItem", h,"","Task 1");
	_ObjectCallMethod( items , "AddBar", h1,"Task","1/2/2001","1/4/2001","K1");
	h2 = _ObjectCallMethod( items , "InsertItem", h1,"","Task 2");
	_ObjectCallMethod( items , "AddBar", h2,"Task","1/15/2001","1/17/2001","K4");
	h2 = _ObjectCallMethod( items , "InsertItem", h1,"","Task 3");
	_ObjectCallMethod( items , "AddBar", h2,"Task","1/5/2001","1/7/2001","K2");
	_ObjectCallMethod( items , "AddLink", "L1",h1,"K1",h2,"K2");
	_ObjectCallMethod(g2antt, "TemplatePut", "Dim iteObj")
	_ObjectCallMethod(g2antt, "TemplatePut", items)
	_ObjectCallMethod(g2antt, "ExecuteTemplate", "iteObj.Link(`L1`,12) = `L1`");
	h3 = _ObjectCallMethod( items , "InsertItem", h,"","Task 3");
	_ObjectCallMethod( items , "AddBar", h3,"Task","1/8/2001","1/10/2001","K3");
	_ObjectCallMethod( items , "AddLink", "L2",h2,"K2",h3,"K3");
	_ObjectCallMethod(g2antt, "ExecuteTemplate", "iteObj.Link(`L2`,12) = `L2`");
	_ObjectCallMethod(g2antt, "TemplatePut", "Dim iteObj,h")
	_ObjectCallMethod(g2antt, "TemplatePut", items)
	_ObjectCallMethod(g2antt, "TemplatePut", h)
	_ObjectCallMethod(g2antt, "ExecuteTemplate", "iteObj.ExpandItem(h) = True");
	_ObjectCallMethod(g2antt, "TemplatePut", "Dim iteObj,h1")
	_ObjectCallMethod(g2antt, "TemplatePut", items)
	_ObjectCallMethod(g2antt, "TemplatePut", h1)
	_ObjectCallMethod(g2antt, "ExecuteTemplate", "iteObj.ExpandItem(h1) = True");
	h = _ObjectCallMethod( items , "AddItem", "Group 2");
	_ObjectCallMethod(g2antt, "TemplatePut", "Dim iteObj,h")
	_ObjectCallMethod(g2antt, "TemplatePut", items)
	_ObjectCallMethod(g2antt, "TemplatePut", h)
	_ObjectCallMethod(g2antt, "ExecuteTemplate", "iteObj.ItemBold(h) = True");
	_ObjectCallMethod(g2antt, "ExecuteTemplate", "iteObj.ItemDivider(h) = 0");
	_ObjectCallMethod(g2antt, "TemplatePut", "Dim iteObj")
	_ObjectCallMethod(g2antt, "TemplatePut", items)
	_ObjectCallMethod(g2antt, "ExecuteTemplate", "iteObj.LockedItemCount(2) = 1");
	h = _ObjectCallMethod(g2antt, "ExecuteTemplate", "iteObj.LockedItem(2,0)");
	_ObjectCallMethod(g2antt, "TemplatePut", "Dim iteObj,h")
	_ObjectCallMethod(g2antt, "TemplatePut", items)
	_ObjectCallMethod(g2antt, "TemplatePut", h)
	_ObjectCallMethod(g2antt, "ExecuteTemplate", "iteObj.CellValue(h,0) = `Click a row, and move by dragging <b>up, down</b> to change the row's parent or <b>left,right</b> to increase or decrease the indentation.`");
	_ObjectCallMethod(g2antt, "ExecuteTemplate", "iteObj.CellSingleLine(h,0) = False");
	_ObjectCallMethod(g2antt, "ExecuteTemplate", "iteObj.CellValueFormat(h,0) = 1");
_ObjectCallMethod( g2antt , "EndUpdate");
|
|
1404
|
Is it possible to allow moving an item to another, but keeping its indentation
OBJECT chart,g2antt,items;

g2antt =  ObjectByName("AN1") ;
_ObjectCallMethod( g2antt , "BeginUpdate");
_ObjectCallMethod( _ObjectGetProperty( g2antt , "VisualAppearance") , "Add", 1,"c:\exontrol\images\normal.ebn");
_ObjectSetProperty( g2antt , "AutoDrag", 2);
_ObjectSetProperty( g2antt , "LinesAtRoot", 0);
_ObjectSetProperty( g2antt , "HasLines", 2);
_ObjectSetProperty( g2antt , "ShowFocusRect", 0);
_ObjectCallMethod( _ObjectGetProperty( g2antt , "Columns") , "Add", "Task");
chart = _ObjectGetProperty( g2antt , "Chart");
	_ObjectSetProperty( chart , "ShowNonworkingDates", 0);
	_ObjectSetProperty( chart , "FirstVisibleDate", "12/29/2000");
	_ObjectCallMethod(g2antt, "TemplatePut", "Dim chaObj")
	_ObjectCallMethod(g2antt, "TemplatePut", chart)
	_ObjectCallMethod(g2antt, "ExecuteTemplate", "chaObj.PaneWidth(False) = 96");
	_ObjectSetProperty( chart , "LevelCount", 2);
	_ObjectCallMethod(g2antt, "ExecuteTemplate", "chaObj.Bars.Item(`Task`).Color = 16777216");
items = _ObjectGetProperty( g2antt , "Items");
	h = _ObjectCallMethod( items , "AddItem", "Group 1");
	_ObjectCallMethod(g2antt, "TemplatePut", "Dim iteObj,h")
	_ObjectCallMethod(g2antt, "TemplatePut", items)
	_ObjectCallMethod(g2antt, "TemplatePut", h)
	_ObjectCallMethod(g2antt, "ExecuteTemplate", "iteObj.ItemDivider(h) = 0");
	_ObjectCallMethod(g2antt, "ExecuteTemplate", "iteObj.ItemBold(h) = True");
	h1 = _ObjectCallMethod( items , "InsertItem", h,"","Task 1");
	_ObjectCallMethod( items , "AddBar", h1,"Task","1/2/2001","1/4/2001","K1");
	h2 = _ObjectCallMethod( items , "InsertItem", h,"","Task 2");
	_ObjectCallMethod( items , "AddBar", h2,"Task","1/5/2001","1/7/2001","K2");
	_ObjectCallMethod( items , "AddLink", "L1",h1,"K1",h2,"K2");
	_ObjectCallMethod(g2antt, "TemplatePut", "Dim iteObj")
	_ObjectCallMethod(g2antt, "TemplatePut", items)
	_ObjectCallMethod(g2antt, "ExecuteTemplate", "iteObj.Link(`L1`,12) = `L1`");
	h3 = _ObjectCallMethod( items , "InsertItem", h,"","Task 3");
	_ObjectCallMethod( items , "AddBar", h3,"Task","1/8/2001","1/10/2001","K3");
	_ObjectCallMethod( items , "AddLink", "L2",h2,"K2",h3,"K3");
	_ObjectCallMethod(g2antt, "ExecuteTemplate", "iteObj.Link(`L2`,12) = `L2`");
	_ObjectCallMethod(g2antt, "TemplatePut", "Dim iteObj,h")
	_ObjectCallMethod(g2antt, "TemplatePut", items)
	_ObjectCallMethod(g2antt, "TemplatePut", h)
	_ObjectCallMethod(g2antt, "ExecuteTemplate", "iteObj.ExpandItem(h) = True");
	h = _ObjectCallMethod( items , "AddItem", "Group 2");
	_ObjectCallMethod(g2antt, "ExecuteTemplate", "iteObj.ItemBold(h) = True");
	_ObjectCallMethod(g2antt, "ExecuteTemplate", "iteObj.ItemDivider(h) = 0");
_ObjectCallMethod( g2antt , "EndUpdate");
|
|
1403
|
How can I change the row's position to another, by drag and drop. Is it possible
OBJECT chart,g2antt,items;

g2antt =  ObjectByName("AN1") ;
_ObjectCallMethod( g2antt , "BeginUpdate");
_ObjectCallMethod( _ObjectGetProperty( g2antt , "VisualAppearance") , "Add", 1,"c:\exontrol\images\normal.ebn");
_ObjectSetProperty( g2antt , "AutoDrag", 1);
_ObjectCallMethod( _ObjectGetProperty( g2antt , "Columns") , "Add", "Task");
chart = _ObjectGetProperty( g2antt , "Chart");
	_ObjectSetProperty( chart , "ShowNonworkingDates", 0);
	_ObjectSetProperty( chart , "FirstVisibleDate", "12/29/2000");
	_ObjectCallMethod(g2antt, "TemplatePut", "Dim chaObj")
	_ObjectCallMethod(g2antt, "TemplatePut", chart)
	_ObjectCallMethod(g2antt, "ExecuteTemplate", "chaObj.PaneWidth(False) = 64");
	_ObjectSetProperty( chart , "LevelCount", 2);
	_ObjectCallMethod(g2antt, "ExecuteTemplate", "chaObj.Bars.Item(`Task`).Color = 16777216");
items = _ObjectGetProperty( g2antt , "Items");
	h1 = _ObjectCallMethod( items , "AddItem", "Task 1");
	_ObjectCallMethod( items , "AddBar", h1,"Task","1/2/2001","1/4/2001","K1");
	h2 = _ObjectCallMethod( items , "AddItem", "Task 2");
	_ObjectCallMethod( items , "AddBar", h2,"Task","1/5/2001","1/7/2001","K2");
	_ObjectCallMethod( items , "AddLink", "L1",h1,"K1",h2,"K2");
	_ObjectCallMethod(g2antt, "TemplatePut", "Dim iteObj")
	_ObjectCallMethod(g2antt, "TemplatePut", items)
	_ObjectCallMethod(g2antt, "ExecuteTemplate", "iteObj.Link(`L1`,12) = `L1`");
	h3 = _ObjectCallMethod( items , "AddItem", "Task 3");
	_ObjectCallMethod( items , "AddBar", h3,"Task","1/8/2001","1/10/2001","K3");
	_ObjectCallMethod( items , "AddLink", "L2",h2,"K2",h3,"K3");
	_ObjectCallMethod(g2antt, "ExecuteTemplate", "iteObj.Link(`L2`,12) = `L2`");
_ObjectCallMethod( g2antt , "EndUpdate");
|
|
1402
|
Is it possible to scroll the control's content by clicking and moving the mouse up or down
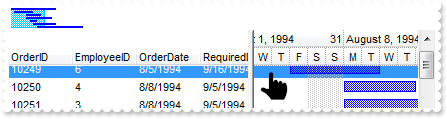
// AddItem event - Occurs after a new Item has been inserted to Items collection.
FUNCTION g2anttEvents_AddItem(OBJECT g2antt, INT Item)
	OBJECT items;
	items = _ObjectGetProperty( g2antt , "Items");
		_ObjectCallMethod(g2antt, "TemplatePut", "Dim iteObj,Item")
		_ObjectCallMethod(g2antt, "TemplatePut", items)
		_ObjectCallMethod(g2antt, "TemplatePut", Item)
		_ObjectCallMethod( items , "AddBar", Item,"Task",_ObjectCallMethod(g2antt, "ExecuteTemplate", "iteObj.CellValue(Item,2)"),_ObjectCallMethod(g2antt, "ExecuteTemplate", "iteObj.CellValue(Item,4)"));
END

OBJECT chart,g2antt,rs;

g2antt =  ObjectByName("AN1") ;
ObjectAssociateEvents("g2anttEvents", g2antt);
_ObjectCallMethod( g2antt , "BeginUpdate");
chart = _ObjectGetProperty( g2antt , "Chart");
	_ObjectSetProperty( chart , "FirstVisibleDate", "8/3/1994");
	_ObjectCallMethod(g2antt, "TemplatePut", "Dim chaObj")
	_ObjectCallMethod(g2antt, "TemplatePut", chart)
	_ObjectCallMethod(g2antt, "ExecuteTemplate", "chaObj.PaneWidth(False) = 256");
	_ObjectSetProperty( chart , "LevelCount", 2);
	_ObjectSetProperty( chart , "UnitScale", 4096);
	_ObjectSetProperty( chart , "FirstWeekDay", 1);
	_ObjectSetProperty( chart , "OverviewVisible", 2);
_ObjectSetProperty( g2antt , "ColumnAutoResize", 0);
_ObjectSetProperty( g2antt , "ContinueColumnScroll", 0);
rs = CreateObject("ADOR.Recordset");
	_ObjectCallMethod( rs , "Open", "Orders","Provider=Microsoft.ACE.OLEDB.12.0;Data Source=C:\Program Files\Exontrol\ExG2antt\Sample\Access\misc.accdb",3,3);
_ObjectSetProperty( g2antt , "DataSource", rs);
_ObjectSetProperty( g2antt , "AutoDrag", 16);
_ObjectCallMethod( g2antt , "EndUpdate");
|
|
1401
|
How can I display bars so they fit the entire height ( height of the row )
OBJECT chart,column,columns,g2antt,items,level;

g2antt =  ObjectByName("AN1") ;
_ObjectCallMethod( g2antt , "BeginUpdate");
_ObjectCallMethod( _ObjectGetProperty( g2antt , "VisualAppearance") , "Add", 1,"c:\exontrol\images\normal.ebn");
_ObjectSetProperty( g2antt , "DefaultItemHeight", 36);
chart = _ObjectGetProperty( g2antt , "Chart");
	_ObjectCallMethod(g2antt, "TemplatePut", "Dim chaObj")
	_ObjectCallMethod(g2antt, "TemplatePut", chart)
	_ObjectCallMethod(g2antt, "ExecuteTemplate", "chaObj.PaneWidth(False) = 164");
	_ObjectSetProperty( chart , "FirstVisibleDate", "1/1/2001");
	_ObjectSetProperty( chart , "UnitWidth", 48);
	_ObjectSetProperty( chart , "LevelCount", 2);
	_ObjectSetProperty( chart , "UnitScale", 65536);
	_ObjectSetProperty( chart , "NonworkingHours", 16253183);
	_ObjectSetProperty( chart , "ShowNonworkingUnits", 0);
	_ObjectSetProperty( chart , "UnitWidth", 16);
	_ObjectSetProperty( chart , "FirstVisibleDate", "1/1/2012 8:00:00 AM");
	_ObjectSetProperty( chart , "DrawGridLines", -1);
	_ObjectSetProperty( _ObjectCallMethod( _ObjectGetProperty( chart , "Bars") , "Add", "Empty") , "Pattern", 0);
	level = _ObjectCallMethod(g2antt, "ExecuteTemplate", "chaObj.Level(0)");
		_ObjectSetProperty( level , "Alignment", 17);
		_ObjectSetProperty( level , "Label", "<%d2%>");
	_ObjectSetProperty( chart , "AllowLinkBars", 0);
	_ObjectSetProperty( chart , "AllowCreateBar", 0);
	_ObjectSetProperty( chart , "BarsAllowSizing", 0);
	_ObjectSetProperty( chart , "AllowSelectObjects", 0);
_ObjectSetProperty( g2antt , "DrawGridLines", -1);
_ObjectSetProperty( g2antt , "ShowFocusRect", 0);
columns = _ObjectGetProperty( g2antt , "Columns");
	column = _ObjectCallMethod( columns , "Add", "CA");
		_ObjectCallMethod(g2antt, "TemplatePut", "Dim colObj")
		_ObjectCallMethod(g2antt, "TemplatePut", column)
		_ObjectCallMethod(g2antt, "ExecuteTemplate", "colObj.Def(16) = False");
		_ObjectCallMethod(g2antt, "ExecuteTemplate", "colObj.Def(17) = 1");
	column = _ObjectCallMethod( columns , "Add", "CB");
		_ObjectCallMethod(g2antt, "ExecuteTemplate", "colObj.Def(16) = False");
		_ObjectCallMethod(g2antt, "ExecuteTemplate", "colObj.Def(17) = 1");
items = _ObjectGetProperty( g2antt , "Items");
	h = _ObjectCallMethod( items , "AddItem", "Address 1.1<br>Line 2.1<br>C1");
	_ObjectCallMethod(g2antt, "TemplatePut", "Dim iteObj,h")
	_ObjectCallMethod(g2antt, "TemplatePut", items)
	_ObjectCallMethod(g2antt, "TemplatePut", h)
	_ObjectCallMethod(g2antt, "ExecuteTemplate", "iteObj.ItemMaxHeight(h) = 96");
	_ObjectCallMethod(g2antt, "ExecuteTemplate", "iteObj.CellValue(h,1) = `Address 1.2<br>Line 2.2<br>C2`");
	_ObjectCallMethod( items , "AddBar", h,"Empty","1/2/2012 8:00:00 AM","1/2/2012 7:00:00 PM","A","This is a bit of text<br>being <font ;9>displayed ion the <b>bar A");
	_ObjectCallMethod(g2antt, "ExecuteTemplate", "iteObj.ItemBar(h,`A`,7) = 16777471");
	_ObjectCallMethod(g2antt, "ExecuteTemplate", "iteObj.ItemBar(h,`A`,4) = 0");
	_ObjectCallMethod(g2antt, "ExecuteTemplate", "iteObj.ItemBar(h,`A`,5) = 2");
	_ObjectCallMethod( items , "AddBar", h,"Empty","1/3/2012 8:00:00 AM","1/3/2012 7:00:00 PM","B","<fgcolor=FFFFFF>This is a bit of text<br><fgcolor=FFFFFF>being <font ;9>displayed ion the <b>bar B");
	_ObjectCallMethod(g2antt, "ExecuteTemplate", "iteObj.ItemBar(h,`B`,7) = 33488896");
	_ObjectCallMethod(g2antt, "ExecuteTemplate", "iteObj.ItemBar(h,`B`,4) = 2");
	_ObjectCallMethod(g2antt, "ExecuteTemplate", "iteObj.ItemBar(h,`B`,5) = 0");
	_ObjectCallMethod( items , "AddBar", h,"Empty","1/4/2012 8:00:00 AM","1/4/2012 7:00:00 PM","C","<font Tahoma;12><b>bar C");
	_ObjectCallMethod(g2antt, "ExecuteTemplate", "iteObj.ItemBar(h,`C`,7) = 33489151");
_ObjectCallMethod( g2antt , "EndUpdate");
|